Getting started | Prometheus Configuration | Prometheus Download | Prometheus Download Grafana | Grafana Labs # prometheusmkdir -m=777 -p /data/{downl ...
Configuration | Prometheus Download | Prometheus Download Grafana | Grafana Labs
# prometheus
mkdir -m=777 -p /data/{download,app_logs,app/prometheus}
cd /data/download
wget https://github.com/prometheus/prometheus/releases/download/v2.45.0-rc.0/prometheus-2.45.0-rc.0.linux-amd64.tar.gz
tar xvfz prometheus-*.tar.gz
ln -s /data/download/prometheus-2.45.0-rc.0.linux-amd64/prometheus /usr/bin/prometheus
cp /data/download/prometheus-2.45.0-rc.0.linux-amd64/prometheus.yml /data/app/prometheus/prometheus.yml
prometheus --config.file=/data/app/prometheus/prometheus.yml --web.listen-address=:9090 --web.enable-lifecycle --storage.tsdb.path=/data/app/prometheus/data >>/data/app_logs/prometheus.log 2>&1 &

# node_exporter 在需要監控的伺服器里安裝
mkdir -m=777 -p /data/{download,app_logs,app/prometheus}
cd /data/download
wget https://github.com/prometheus/node_exporter/releases/download/v1.6.0/node_exporter-1.6.0.linux-amd64.tar.gz
tar xvfz node_exporter*
ln -s /data/download/node_exporter-1.6.0.linux-amd64/node_exporter /usr/bin/node_exporter
# 啟動node_exporter,伺服器暴露的埠是8080,同時伺服器里有其他服務占用了8080埠,可以使用nginx將node_exporter獲取指標的api暴露出去
# location /metrics {
#     proxy_pass http://127.0.0.1:9000/metrics;
# }
node_exporter --web.listen-address 127.0.0.1:9000 >>/data/app_logs/node_exporter.log 2>&1 &
# 添加node_exporter之後,需要更新prometheus.xml添加targets,然後運行:curl -X PUT http://server_address:port/-/reload重新載入配置文件

# alert_manager可以和prometheus安裝到同一臺伺服器
cd /data/download
wget https://github.com/prometheus/alertmanager/releases/download/v0.25.0/alertmanager-0.25.0.linux-amd64.tar.gz
tar xvfz alertmanager*
ln -s /data/download/alertmanager-0.25.0.linux-amd64/alertmanager /usr/bin/alertmanager
cp /data/download/alertmanager-0.25.0.linux-amd64/alertmanager.yml /data/app/prometheus/alertmanager.yml
alertmanager --config.file=/data/app/prometheus/alertmanager.yml --web.listen-address 127.0.0.1:9001 >>/data/app_logs/node_exporter.log 2>&1 &
# 將alert_manager的地址添加到prometheus.yml里的alertmanagers的targets里,然後運行:curl -X PUT http://server_address:port/-/reload重新載入配置文件
測試報警郵件功能:設置如果安裝exporter的伺服器記憶體占用率超過50%或者tcp timewait超過10的時候就發郵件(在實際工作中需要設置一個合適的條件):
prometheus.yml里添加rule_files的路徑:
# my global config
global:
  scrape_interval: 15s # Set the scrape interval to every 15 seconds. Default is every 1 minute.
  evaluation_interval: 15s # Evaluate rules every 15 seconds. The default is every 1 minute.
  # scrape_timeout is set to the global default (10s).
# Alertmanager configuration
alerting:
  alertmanagers:
    - static_configs:
        - targets:
          - 127.0.0.1:9001

# Load rules once and periodically evaluate them according to the global 'evaluation_interval'.
rule_files:
  # - "first_rules.yml"
  # - "second_rules.yml"
  - "/data/app/prometheus/alert.rules.yml"

# A scrape configuration containing exactly one endpoint to scrape:
# Here it's Prometheus itself.
scrape_configs:
  # The job name is added as a label `job=<job_name>` to any timeseries scraped from this config.
  - job_name: "prometheus"

    # metrics_path defaults to '/metrics'
    # scheme defaults to 'http'.
    scrape_interval: 5s

    static_configs:
            - targets: ["node1_ip:8080"]
            - targets: ["node2_ip:8080"]
              labels:
                groups: 'container'
alert.rules.yml里添加具體的rule,node_socket_TCP_tw這些具體的指標通過http://node_exporter_ip:port/metrics可以獲取到
groups:
- name: tcp-alert-group
  rules:
  - alert: TcpTimeWait
    expr: node_sockstat_TCP_tw > 10
    for: 10m
    labels:
      severity: warning
    annotations:
      summary: tcp time wait more than 10
      description: please check node_sockstat_TCP_tw metric
  - alert: MemoryUse
    expr: (node_memory_MemTotal_bytes-node_memory_MemFree_bytes-node_memory_Buffers_bytes-node_memory_Cached_bytes)/node_memory_MemTotal_bytes > 0.5
    for: 10m
    labels:
      severity: warning
    annotations:
      summary: memory use more than 50% for 10 min
      description: please check memory use
alertmanager.yml里配置告警郵件的信息:
global:
  resolve_timeout: 5m
  smtp_smarthost: your_smpt_host:port
  smtp_from: alertmanager@your_email_domain
  smtp_require_tls: false
route:
  group_by: ['alertname']
  group_wait: 30s
  group_interval: 5m
  repeat_interval: 10m
  receiver: 'email'
receivers:
  - name: 'email'
    email_configs:
    - to: 'receiver_email'
      send_resolved: true
yml文件一旦更新,需要重新載入配置:curl -X PUT http://server_address:port/-/reload
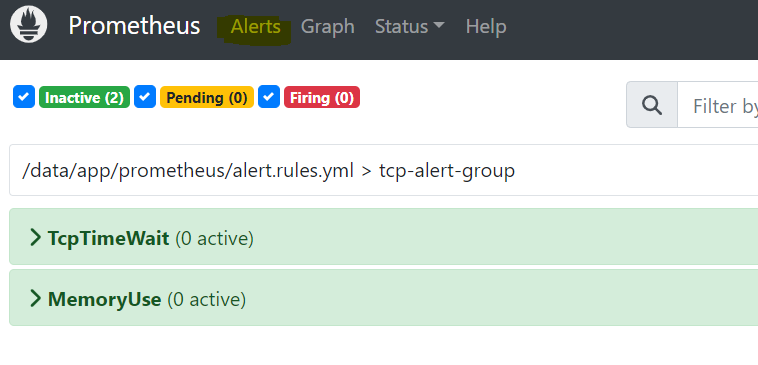
在Prometheus的界面可以看到添加的alert:
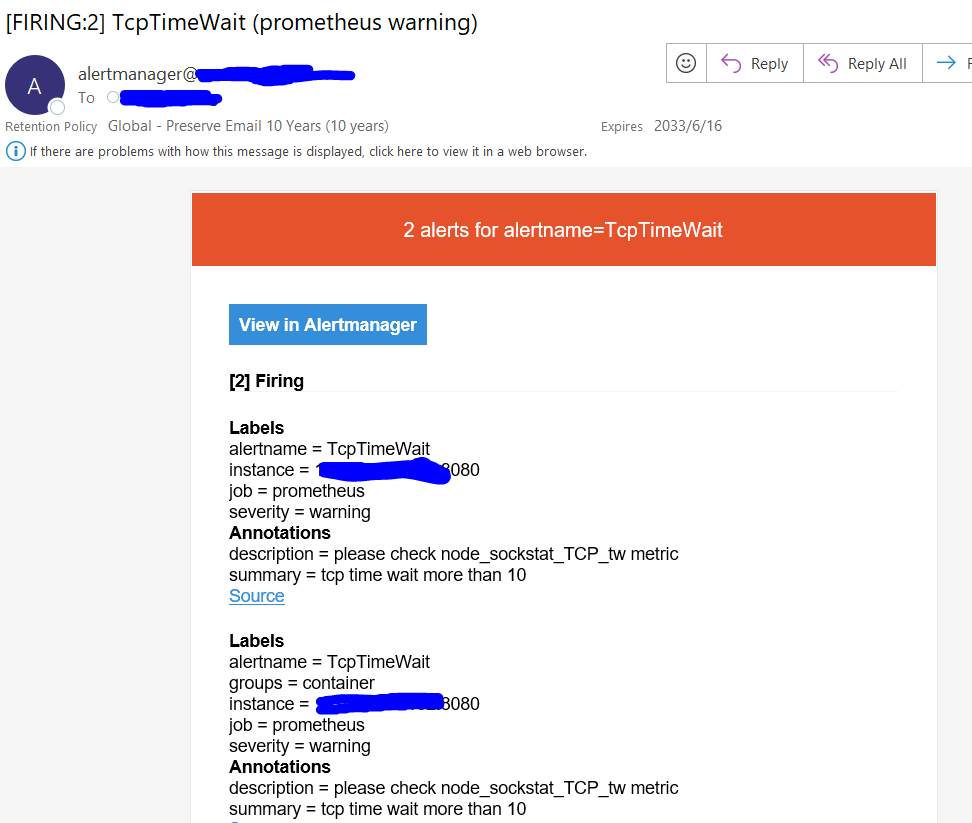
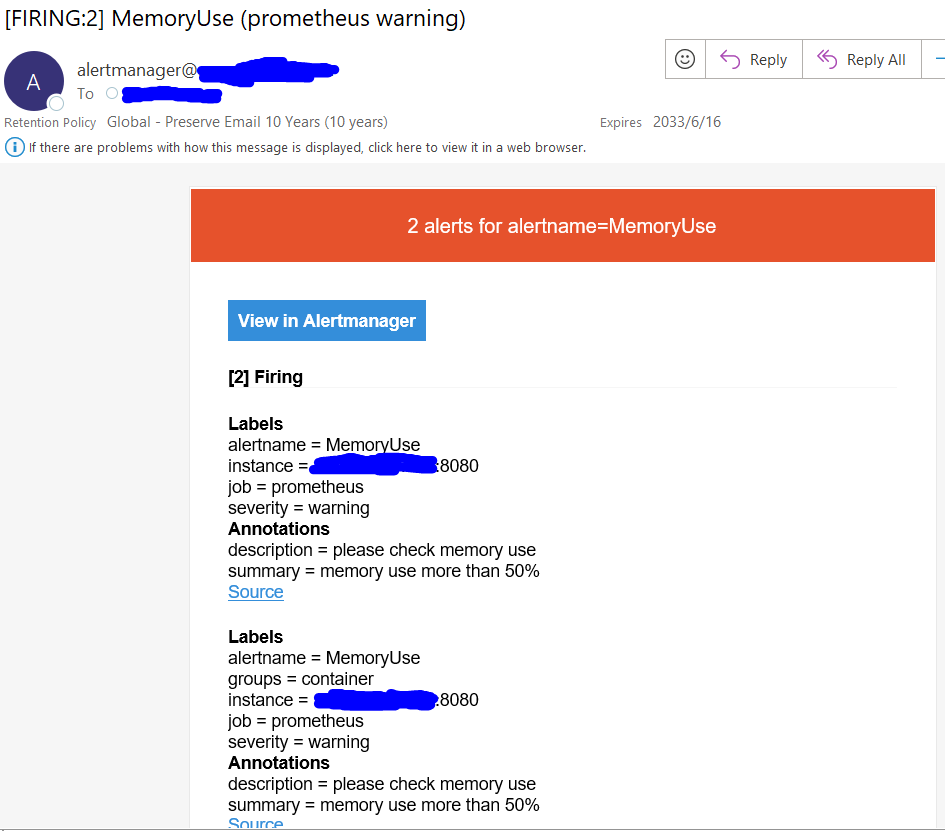
當alert的條件滿足後,alertmanager就會發郵件
grafana的安裝和啟動:
# grafana可以和prometheus里安裝到同一臺伺服器
yum install -y https://dl.grafana.com/enterprise/release/grafana-enterprise-10.0.0-1.x86_64.rpm
# grafana預設啟動的埠號是3000,如果伺服器沒有暴露3000埠的話,需要修改grafana的配置文件
sed -i 's/3000/8080/g' /usr/share/grafana/conf/defaults.ini
grafana server >> /data/app_logs/grafana.log 2>&1 &
# grafana數據保存地址:/var/lib/grafana.db
grafana啟動之後就可以在瀏覽器上打開對應的地址,初次登錄用戶名和密碼:admin/admin
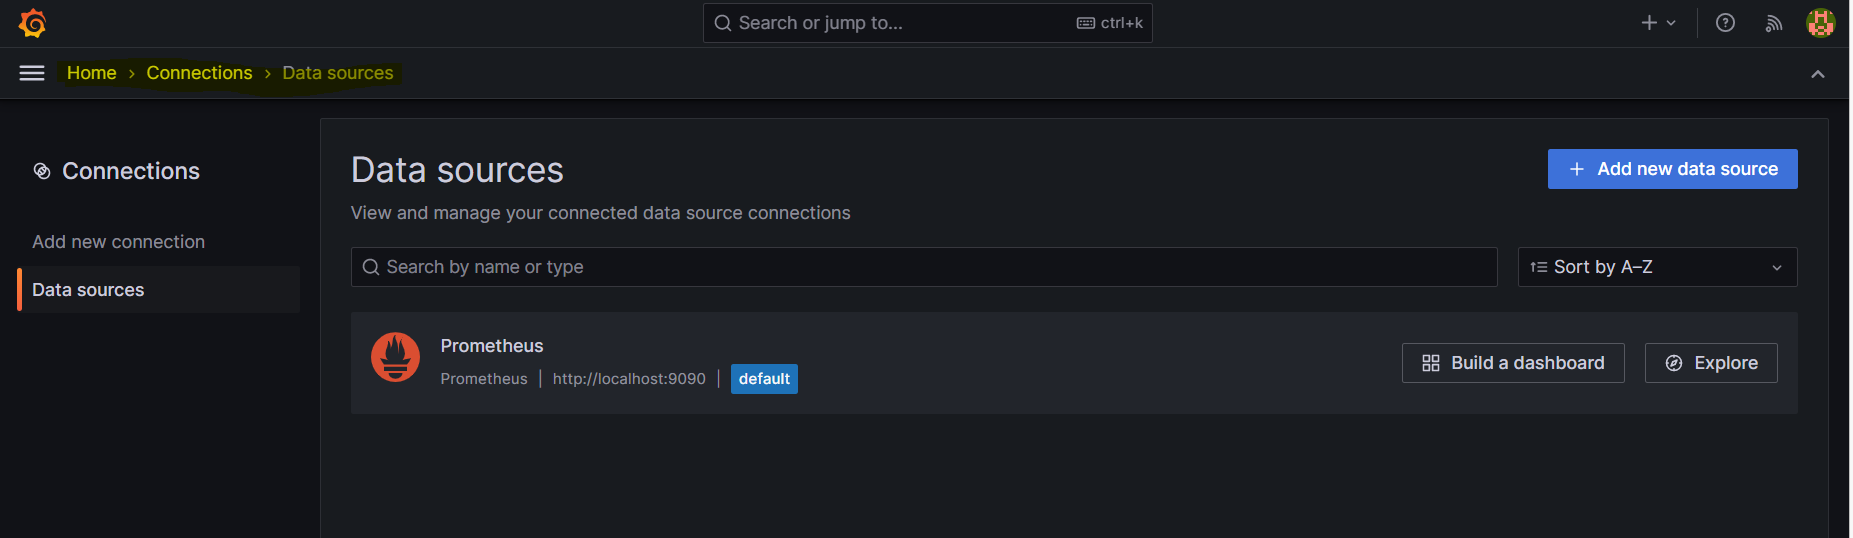
Data sources里添加prometheus,grafana和prometheus啟動在同一臺伺服器里的話,地址就可以用localhost
添加dashboard,在Explore里可以查詢指標並且添加到dashboard
cpu使用率:avg(1-irate(node_cpu_seconds_total{mode="idle"}[1m])) by(instance)
記憶體使用率:(node_memory_MemTotal_bytes-node_memory_MemFree_bytes-node_memory_Buffers_bytes-node_memory_Cached_bytes)/node_memory_MemTotal_bytes
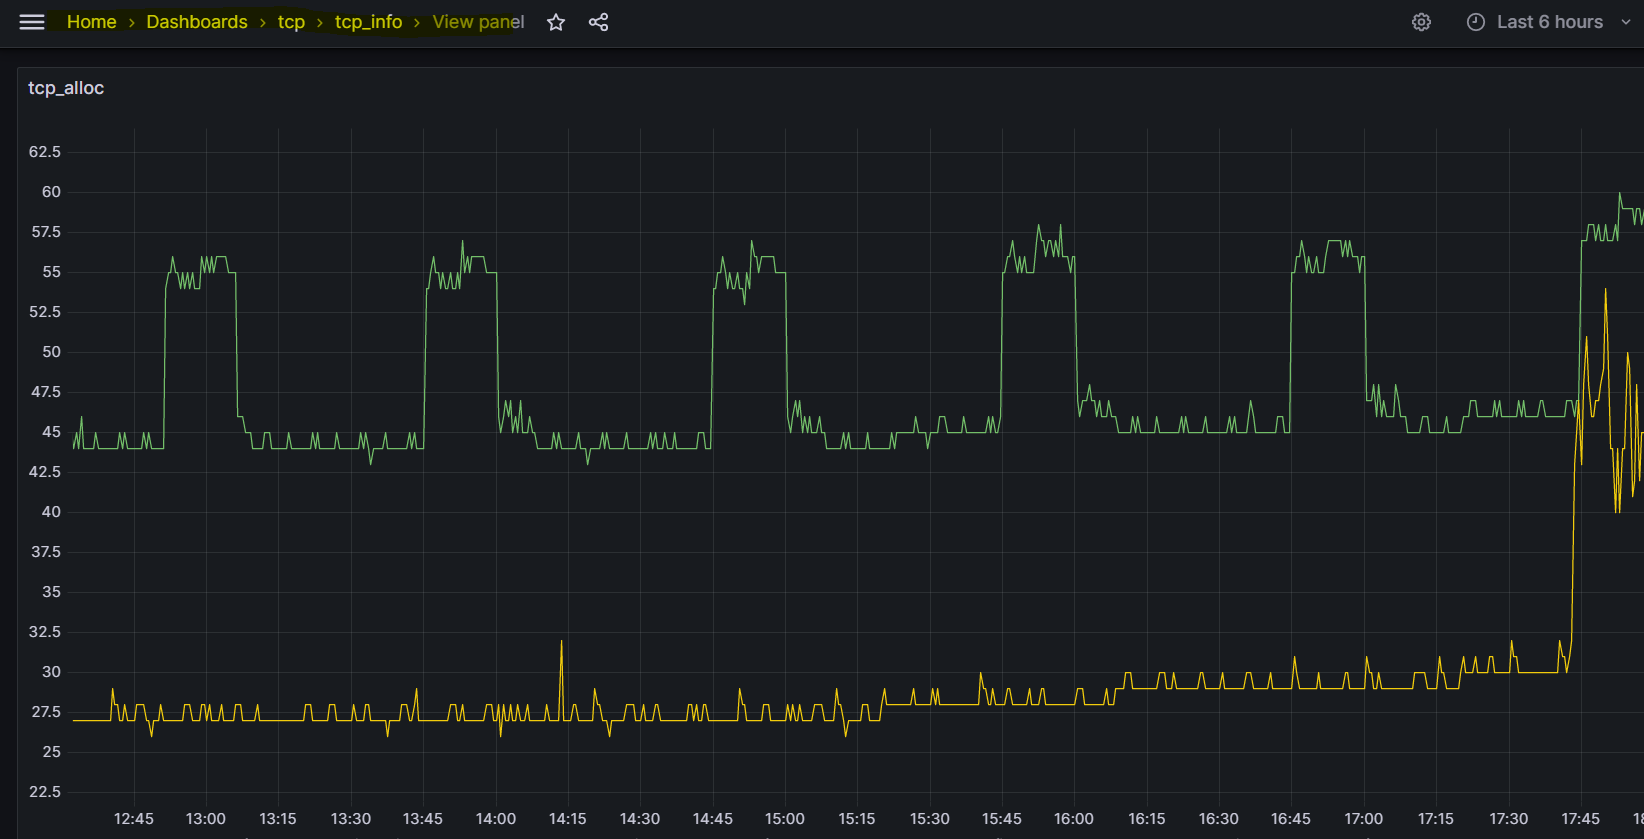
tcp連接數:node_sockstat_TCP_alloc

dashboard:
註意點:
1.prometheus啟動的時候添加--web.enable-lifecycle才允許通過調用/-/reload介面重新載入配置文件
2.prometheus啟動的時候指定一個固定的數據存放位置--storage.tsdb.path=/data/app/prometheus/data,如果數據存放位置不一致,啟動後查不到歷史數據,歷史數據做備份的話,prometheus啟動的伺服器還可以變更
3.grafana的數據保存地址:/var/lib/grafana.db,定期做備份,伺服器發生系統錯誤無法使用的時候,在新的伺服器里同步/var/lib/grafana.db文件之後,啟動grafana之前的配置不會丟失