相關主頁 Prometheus https://prometheus.io/ grafana https://grafana.com/ 安裝Prometheus Linux 可以參考https://www.cnblogs.com/linkanyway/p/Configure-a-Prometheus ...
- 相關主頁
Prometheus https://prometheus.io/
grafana https://grafana.com/
- 安裝Prometheus
Linux 可以參考https://www.cnblogs.com/linkanyway/p/Configure-a-Prometheus-Monitoring-Server-with-a-Gr.html
windows:
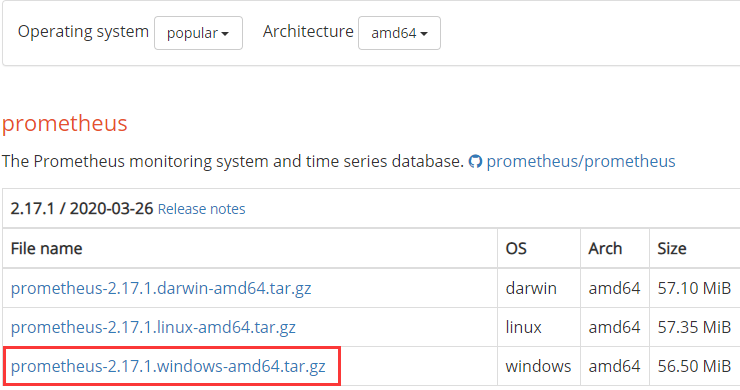
下載地址:https://prometheus.io/download/
下載對應windows版本
解壓後在命令行運行 prometheus.exe
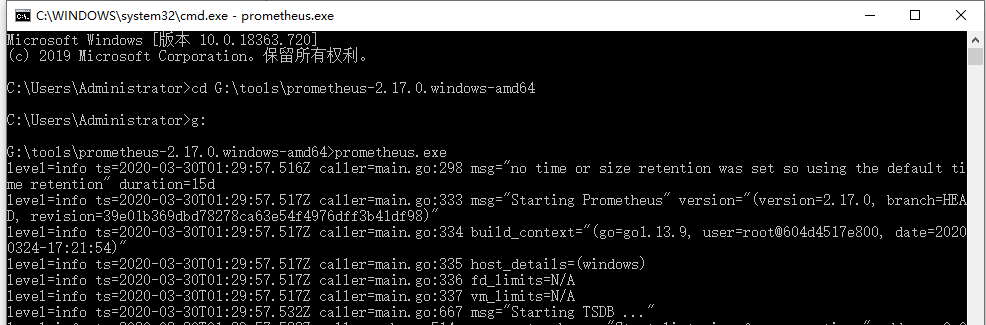
出現以下頁面說明啟動成功:
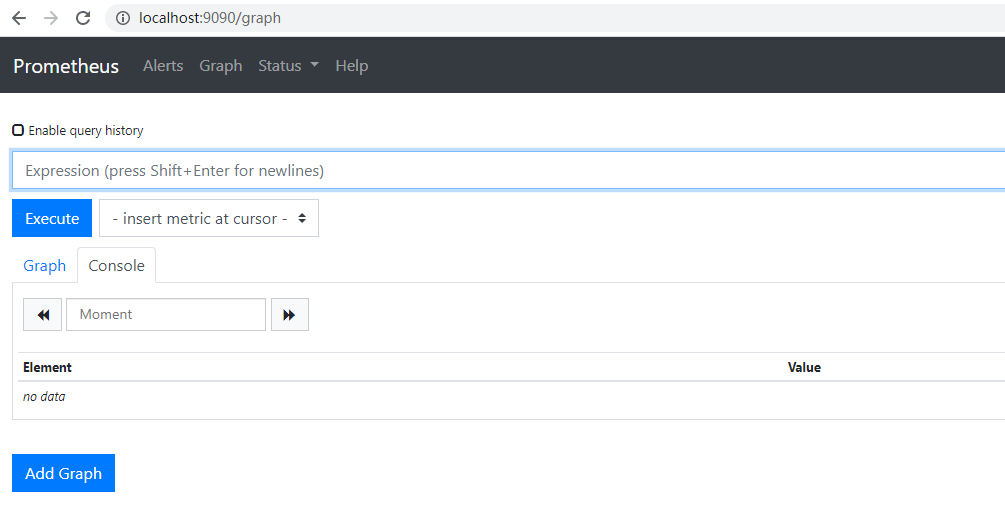
如果要添加監視伺服器可以配置:prometheus.yml
global:
 scrape_interval:     15s
 evaluation_interval: 15s
scrape_configs:
 - job_name: 'prometheus'
   static_configs:
   - targets: ['localhost:9090']
 - job_name: 'node_exporter'
   scrape_interval: 5s
   static_configs:
   - targets: ['localhost:9100']
-
node-exporter
node-exporter是prometheus的服務提供者。
windows版本為:
https://github.com/martinlindhe/wmi_exporter
下載最新的版本。啟動後的預設埠是9182
- 安裝grafana
下載地址:https://grafana.com/grafana/download?platform=windows
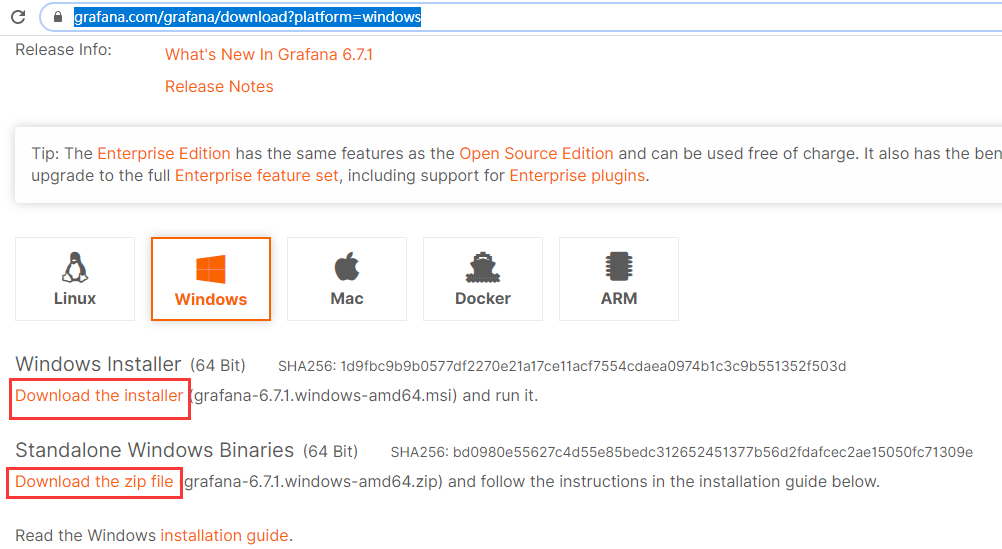
本人選擇的是壓縮包下載,解壓後在命令行運行 grafana-server.exe
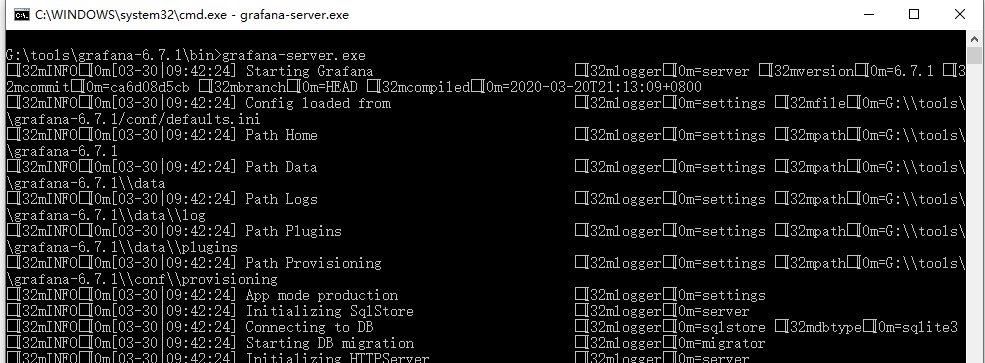
出現以下頁面說明啟動成功

初始用戶名和密碼都是 admin
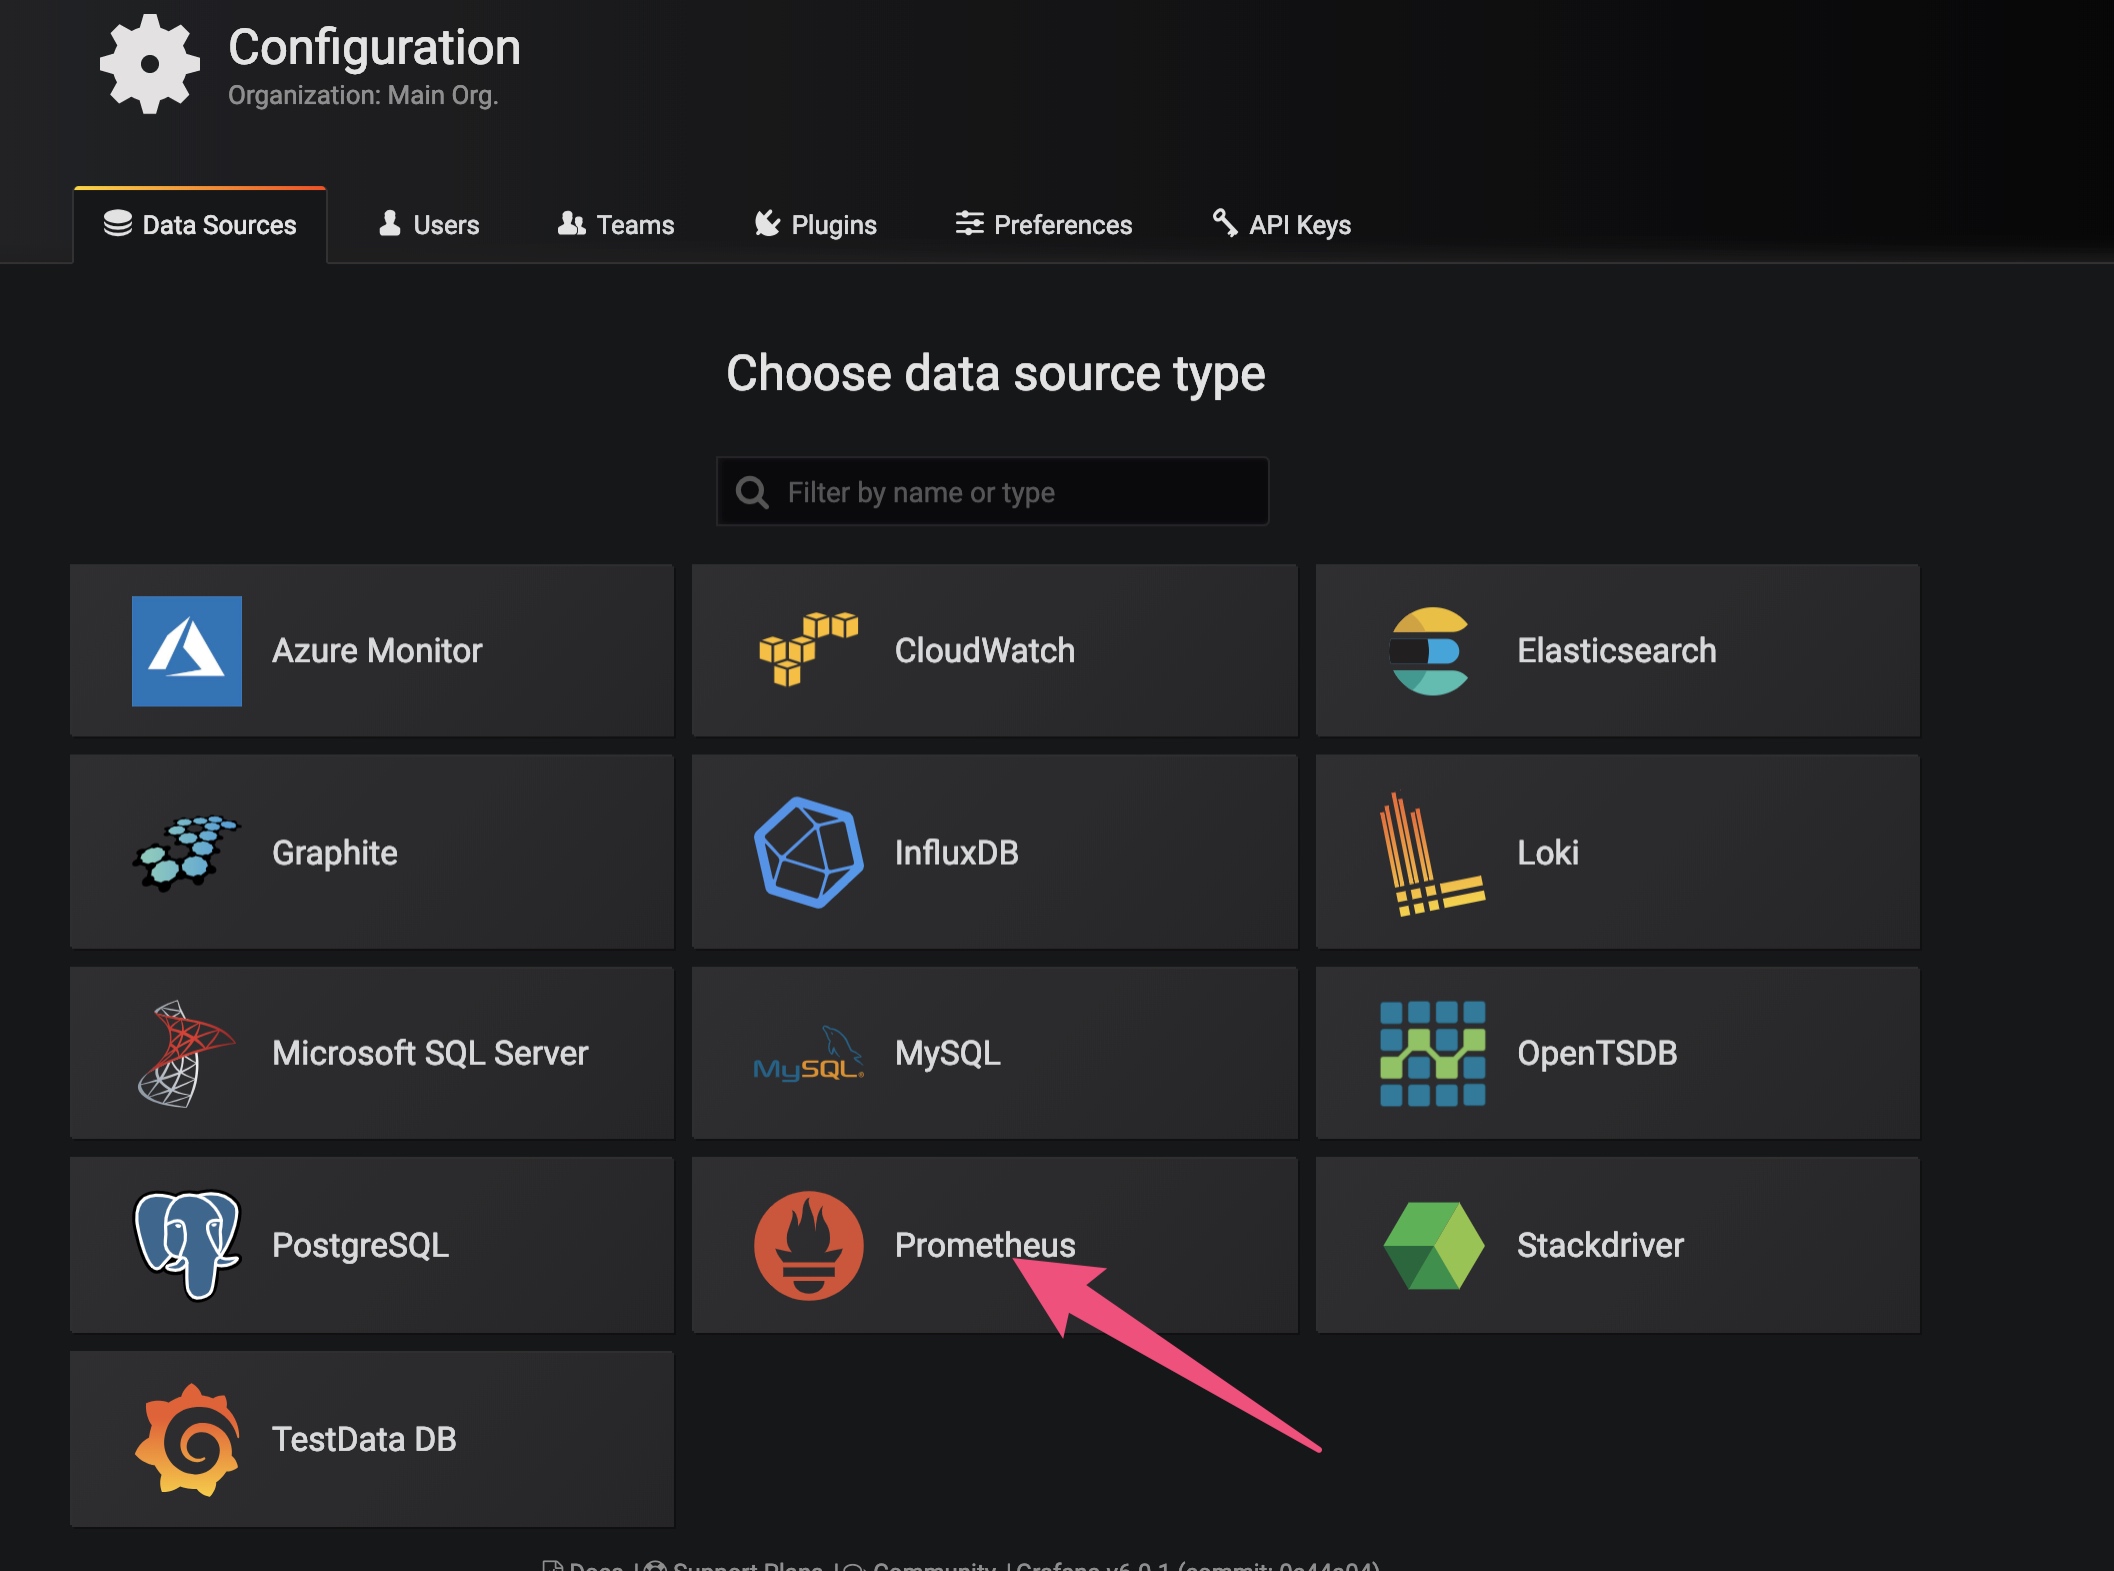
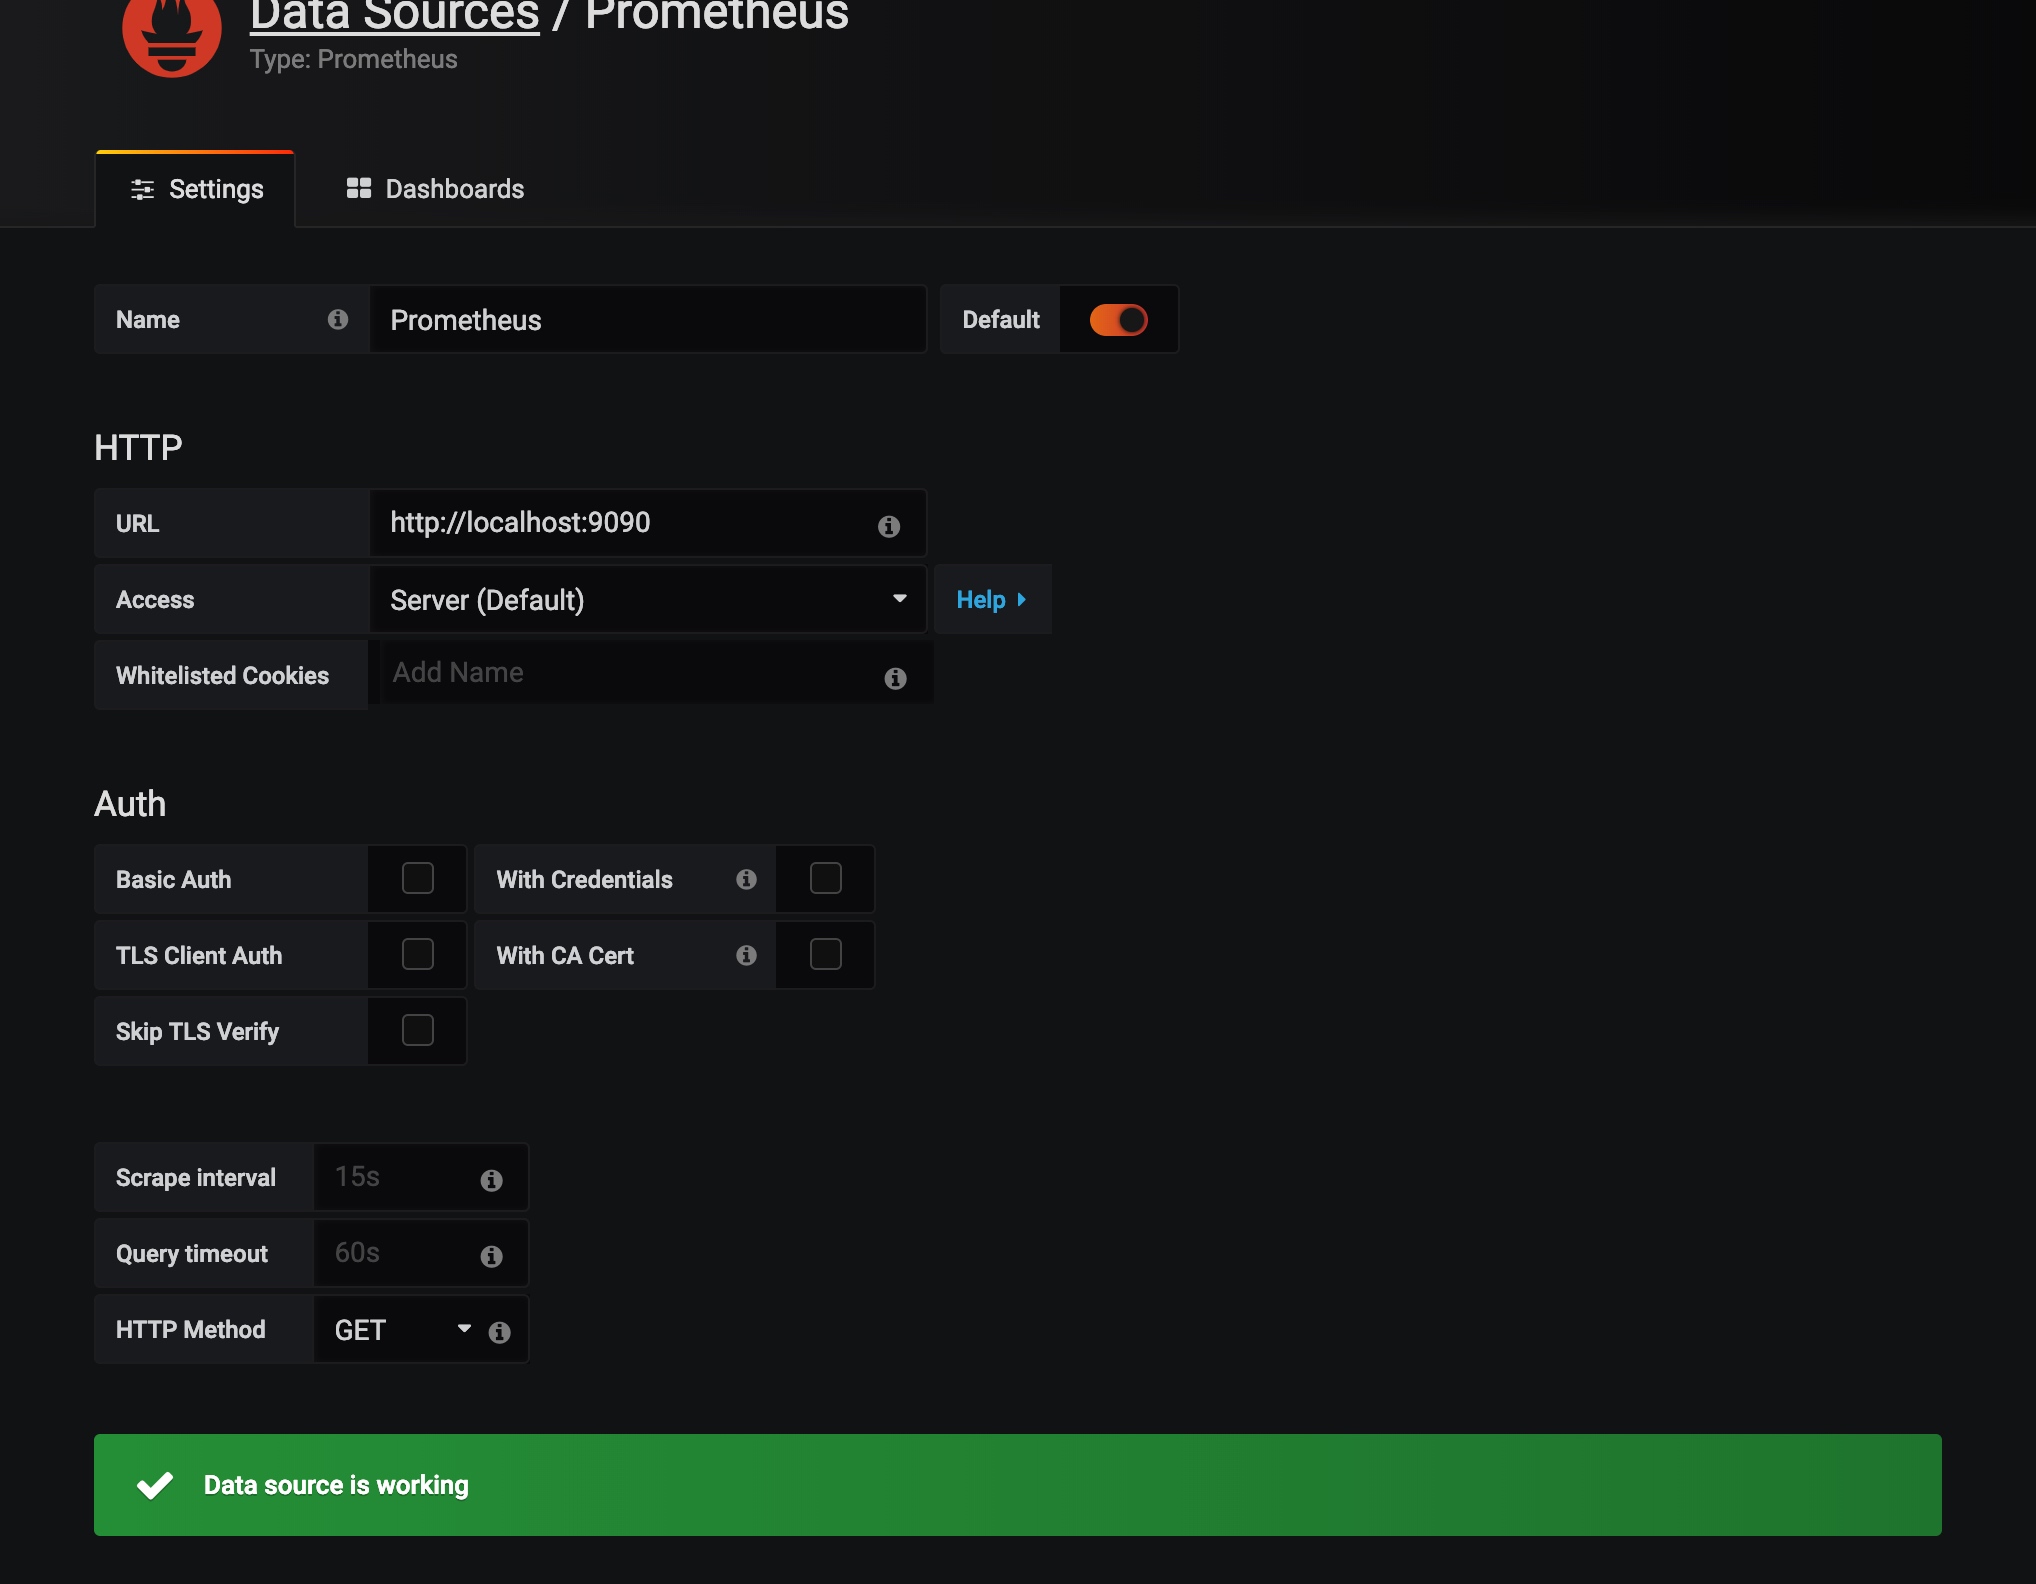
grafana配置prometheus數據源:
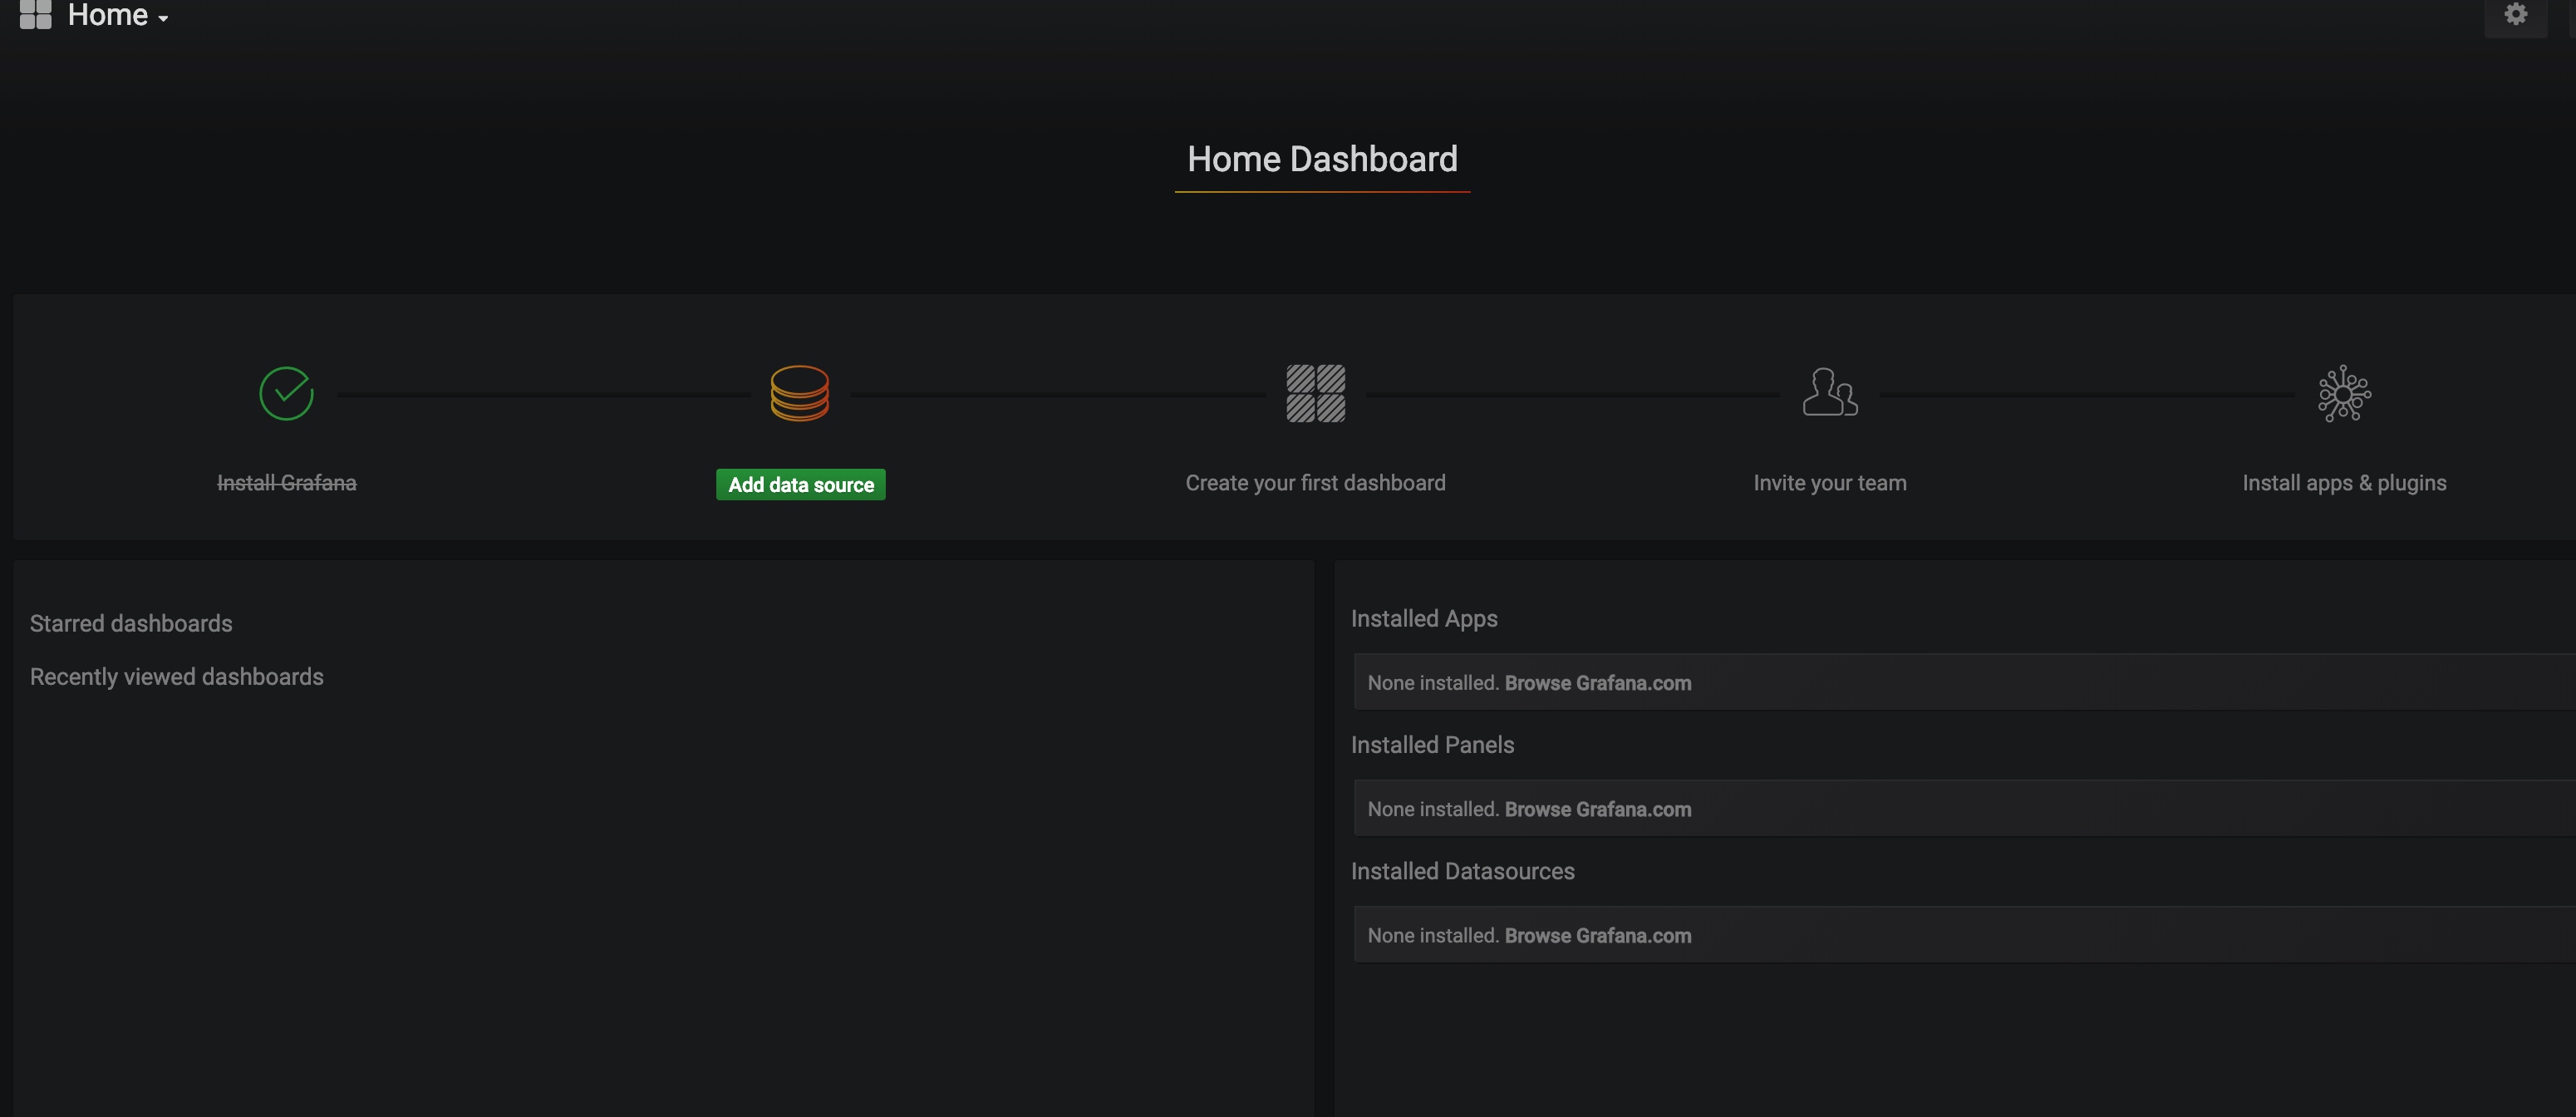
選擇Prometheus數據源
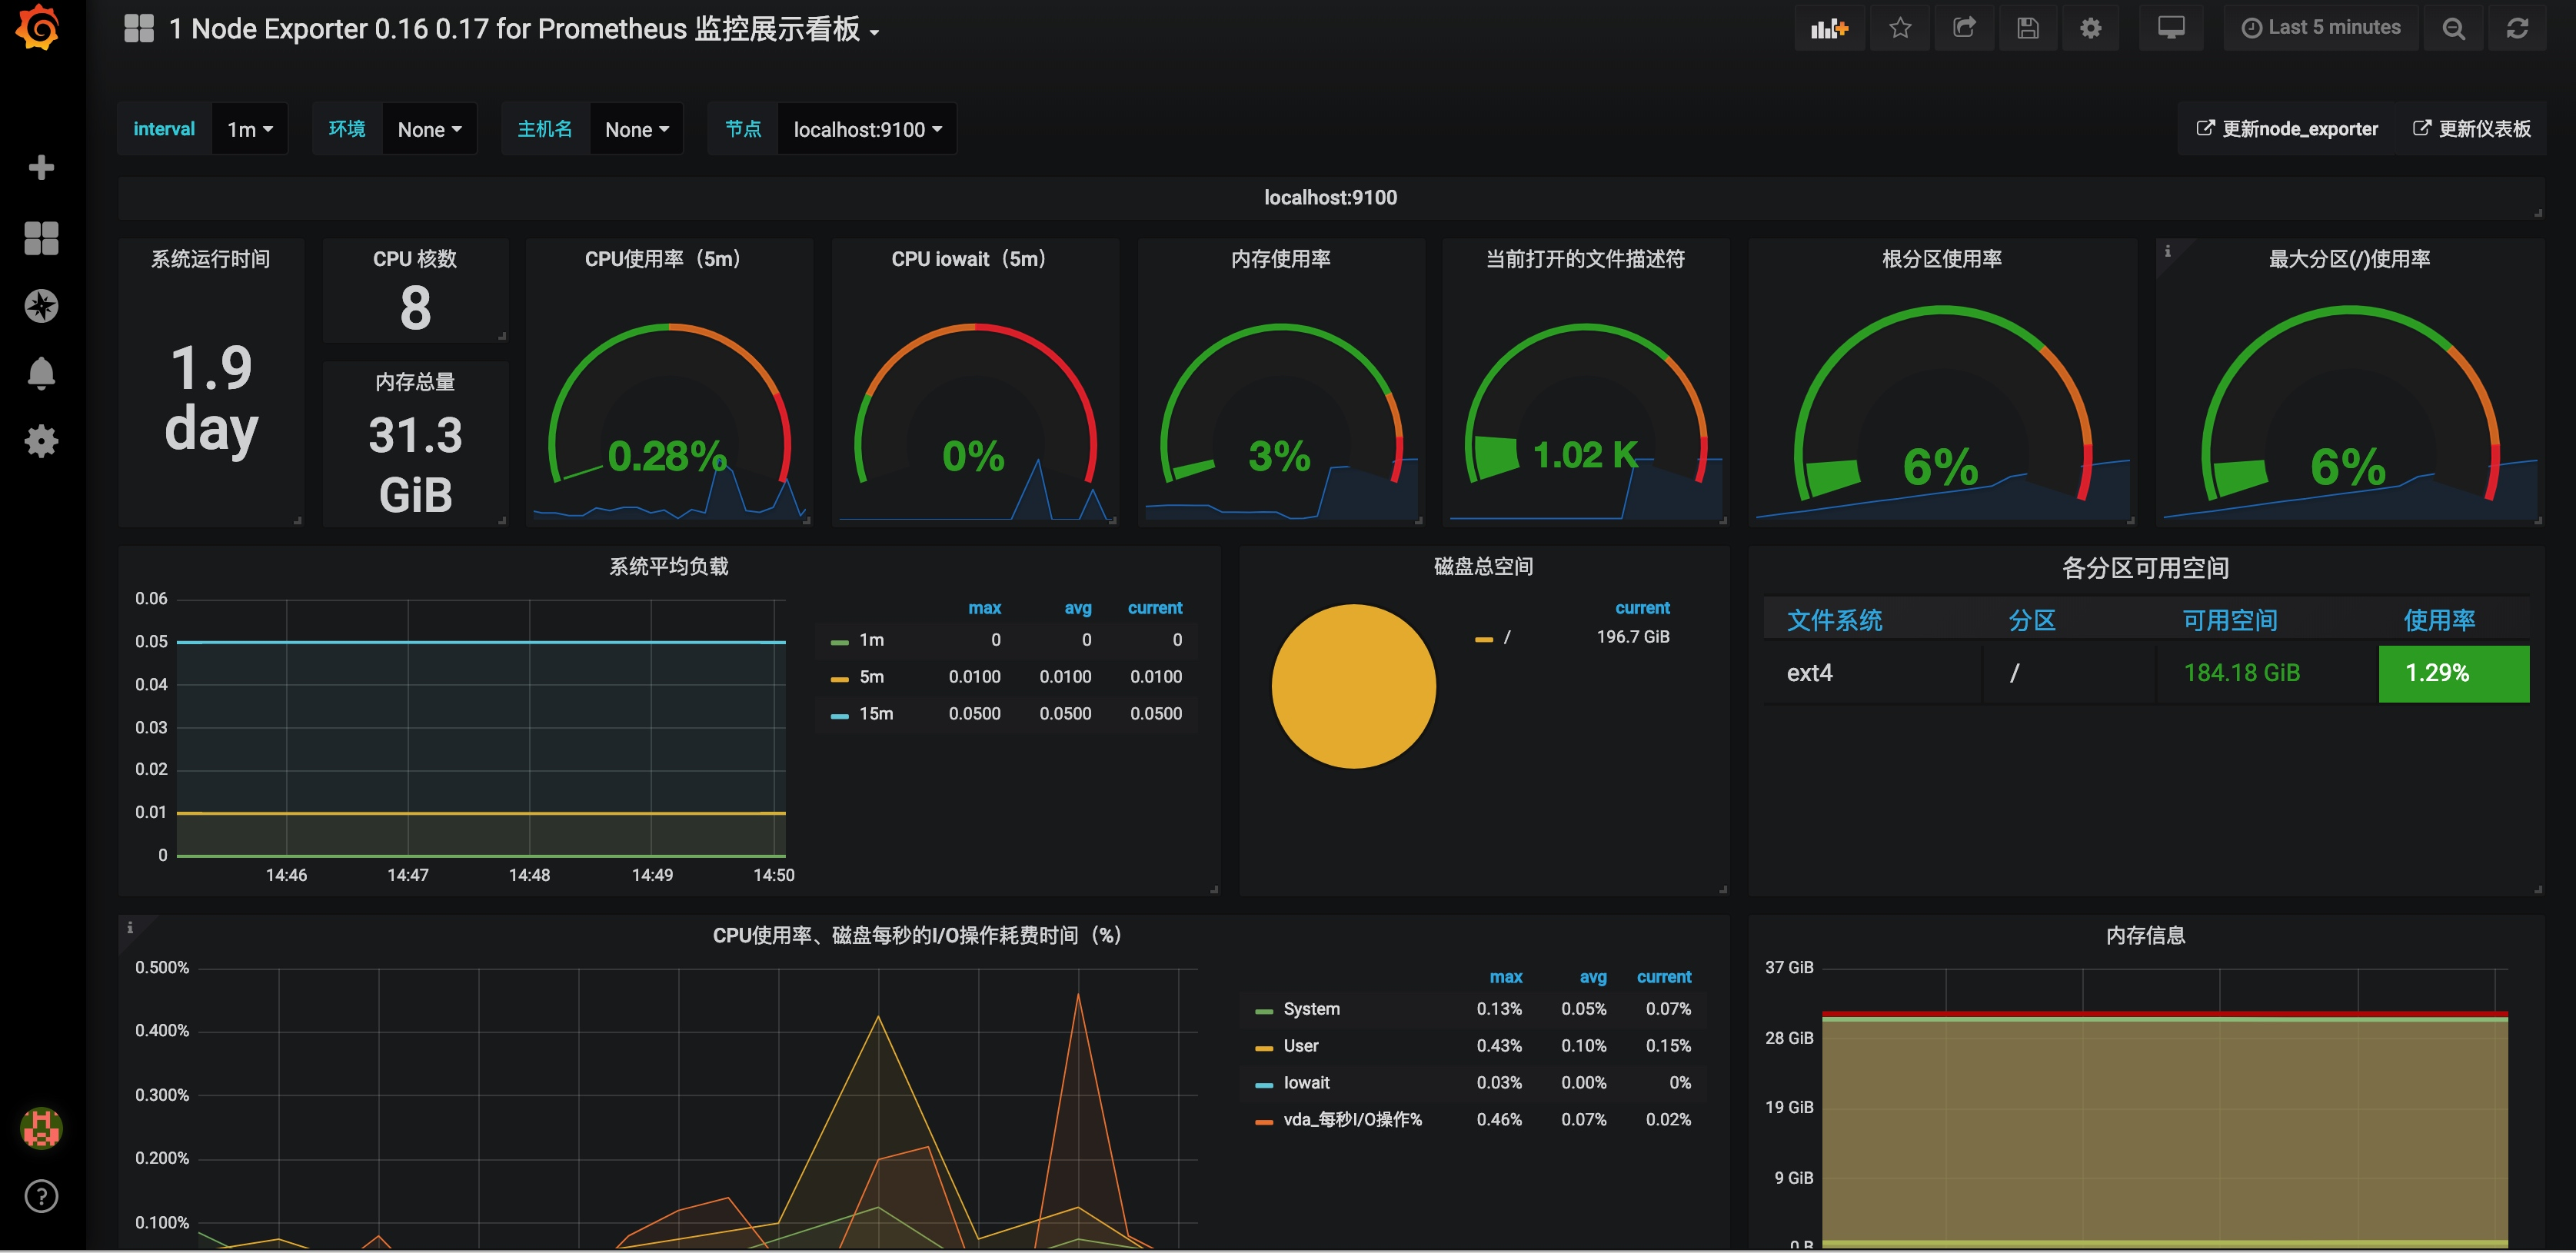
配置儀錶盤
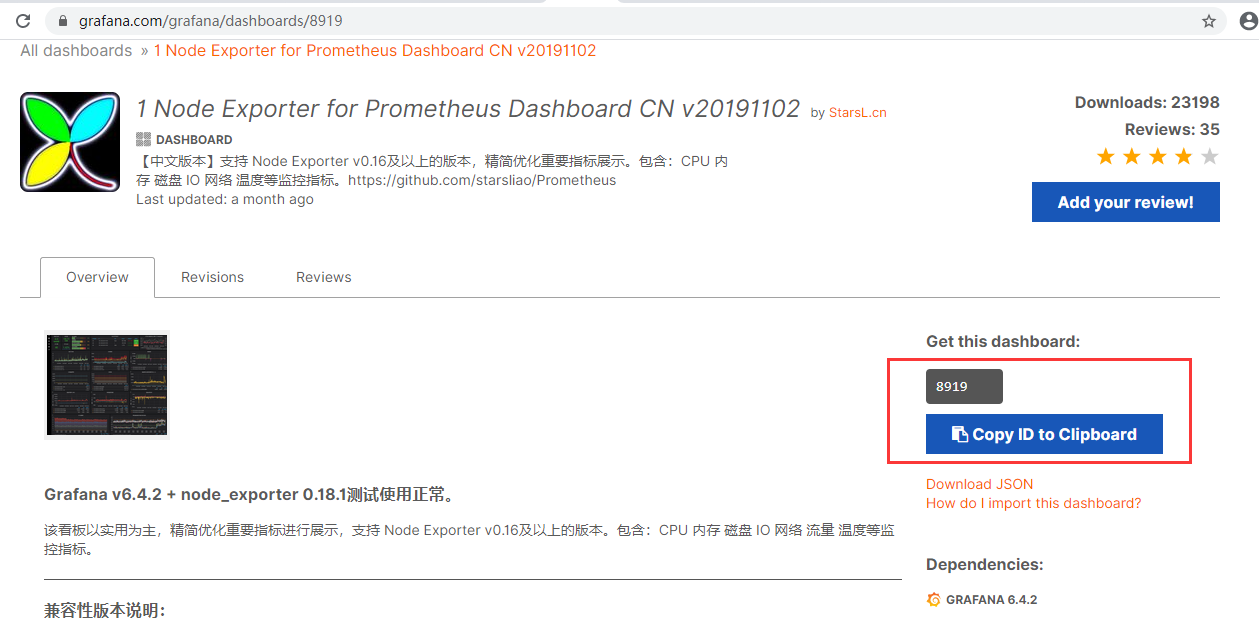
在https://grafana.com/grafana/dashboards?orderBy=name&direction=asc選擇合適的儀錶盤
導入儀錶板:
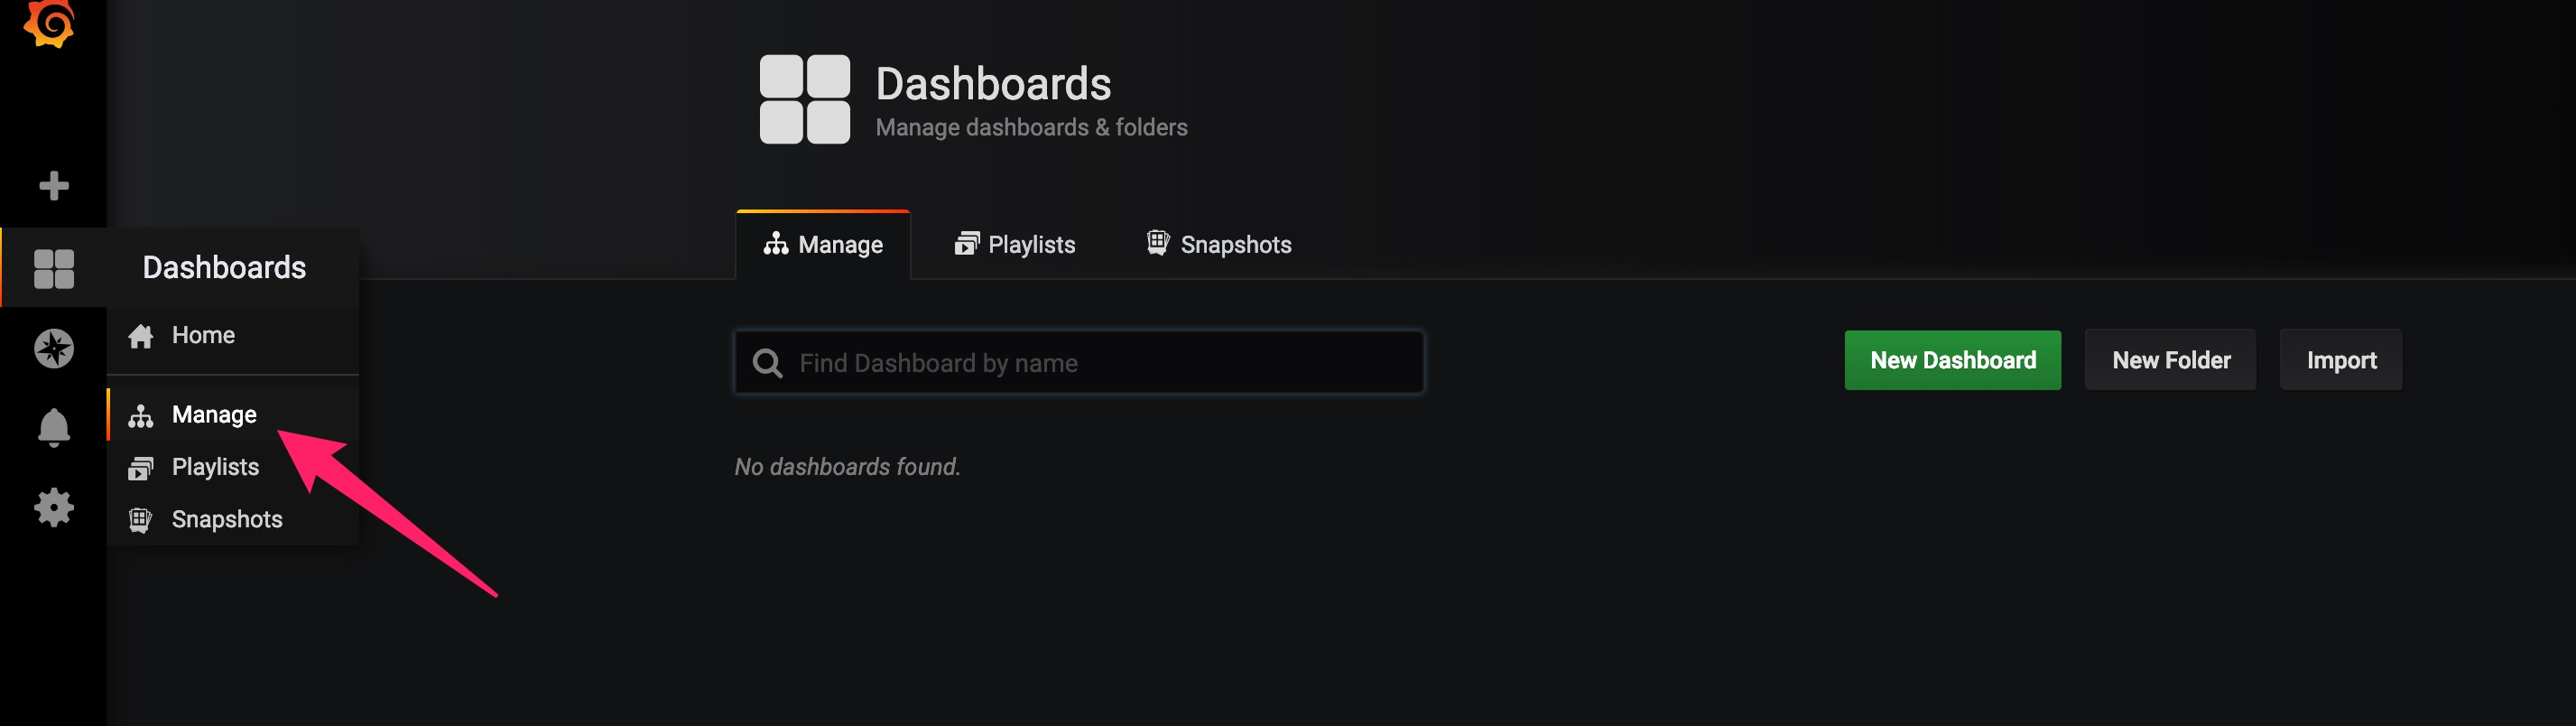
選擇import
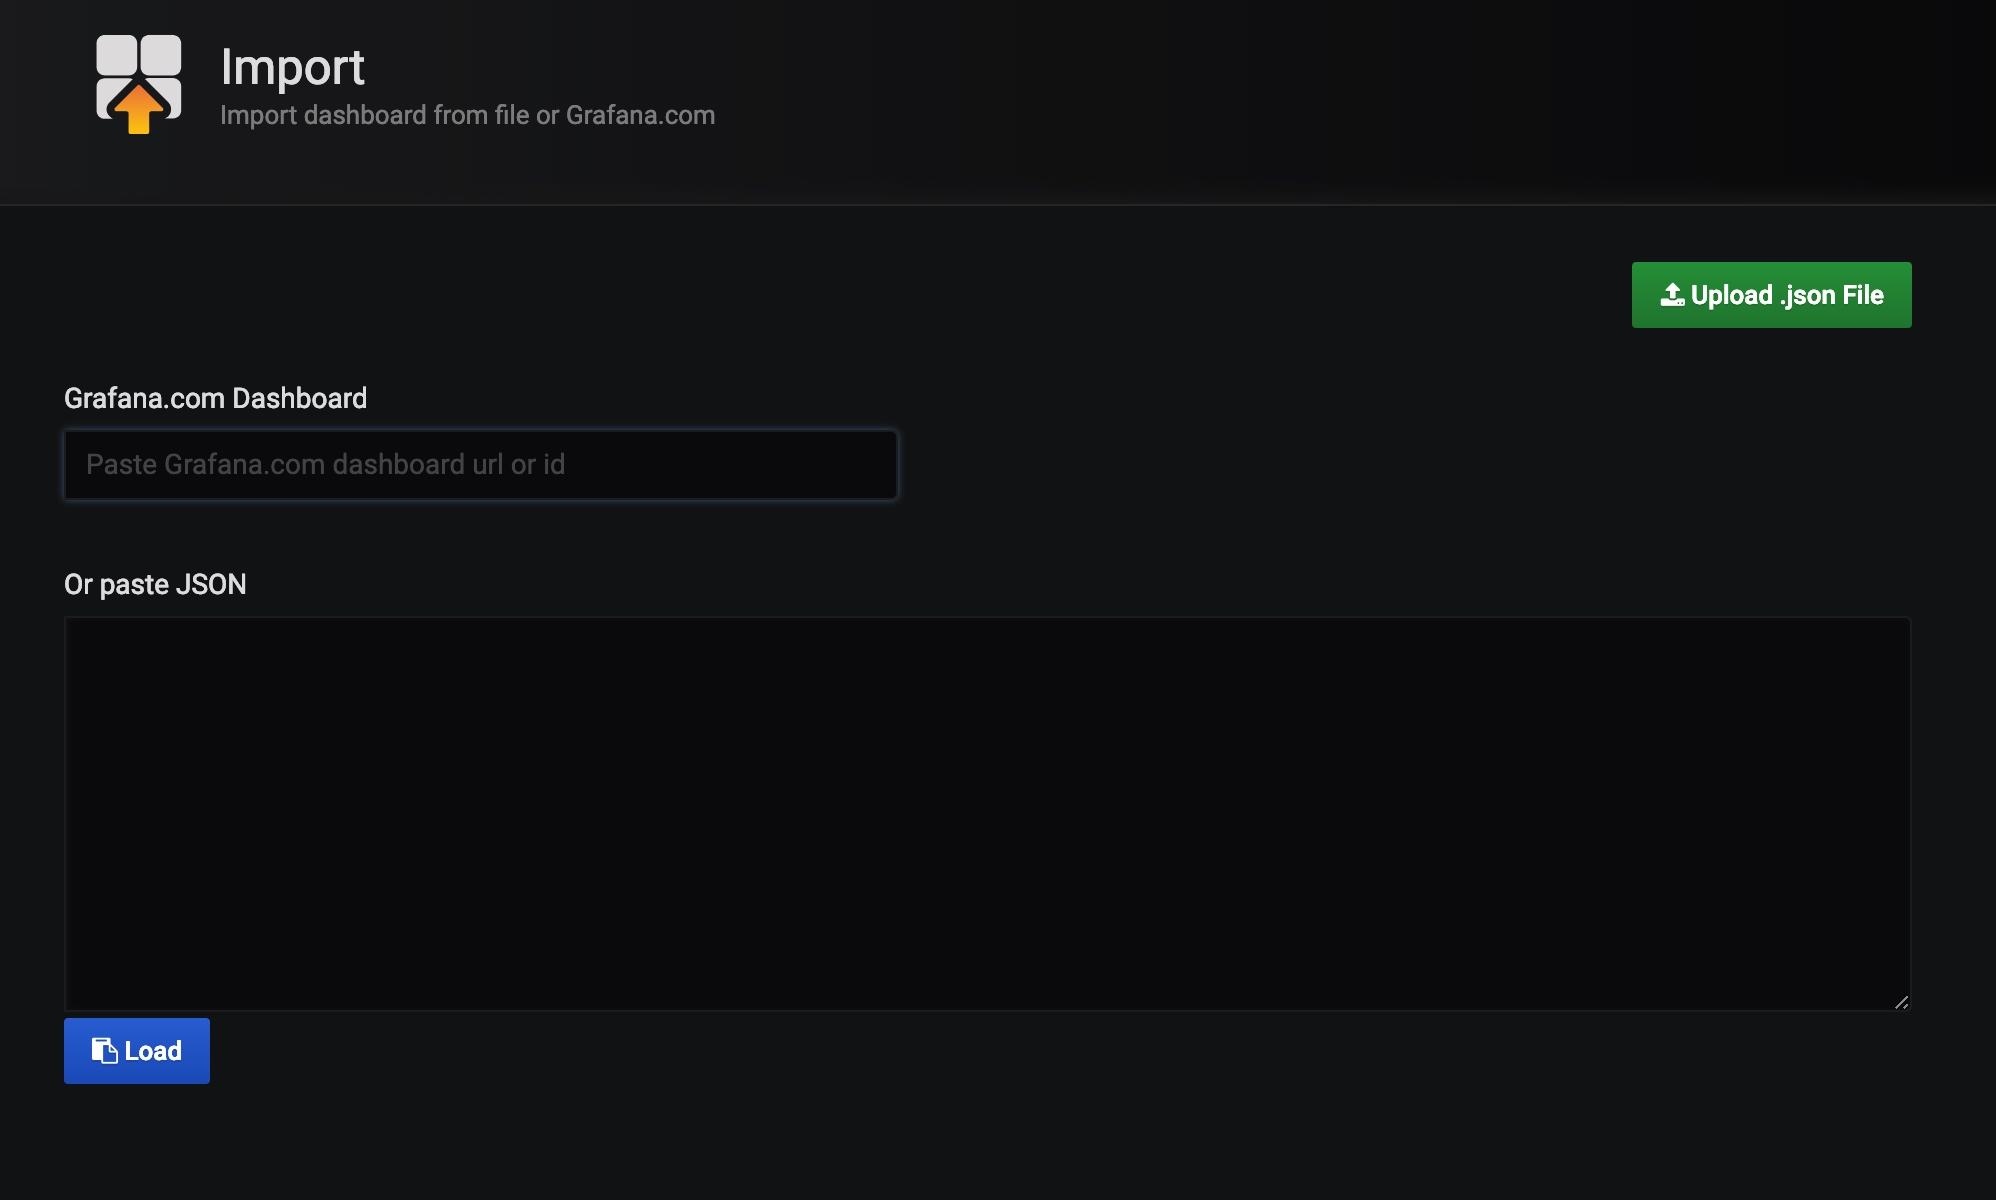
然後輸入之前記錄的id
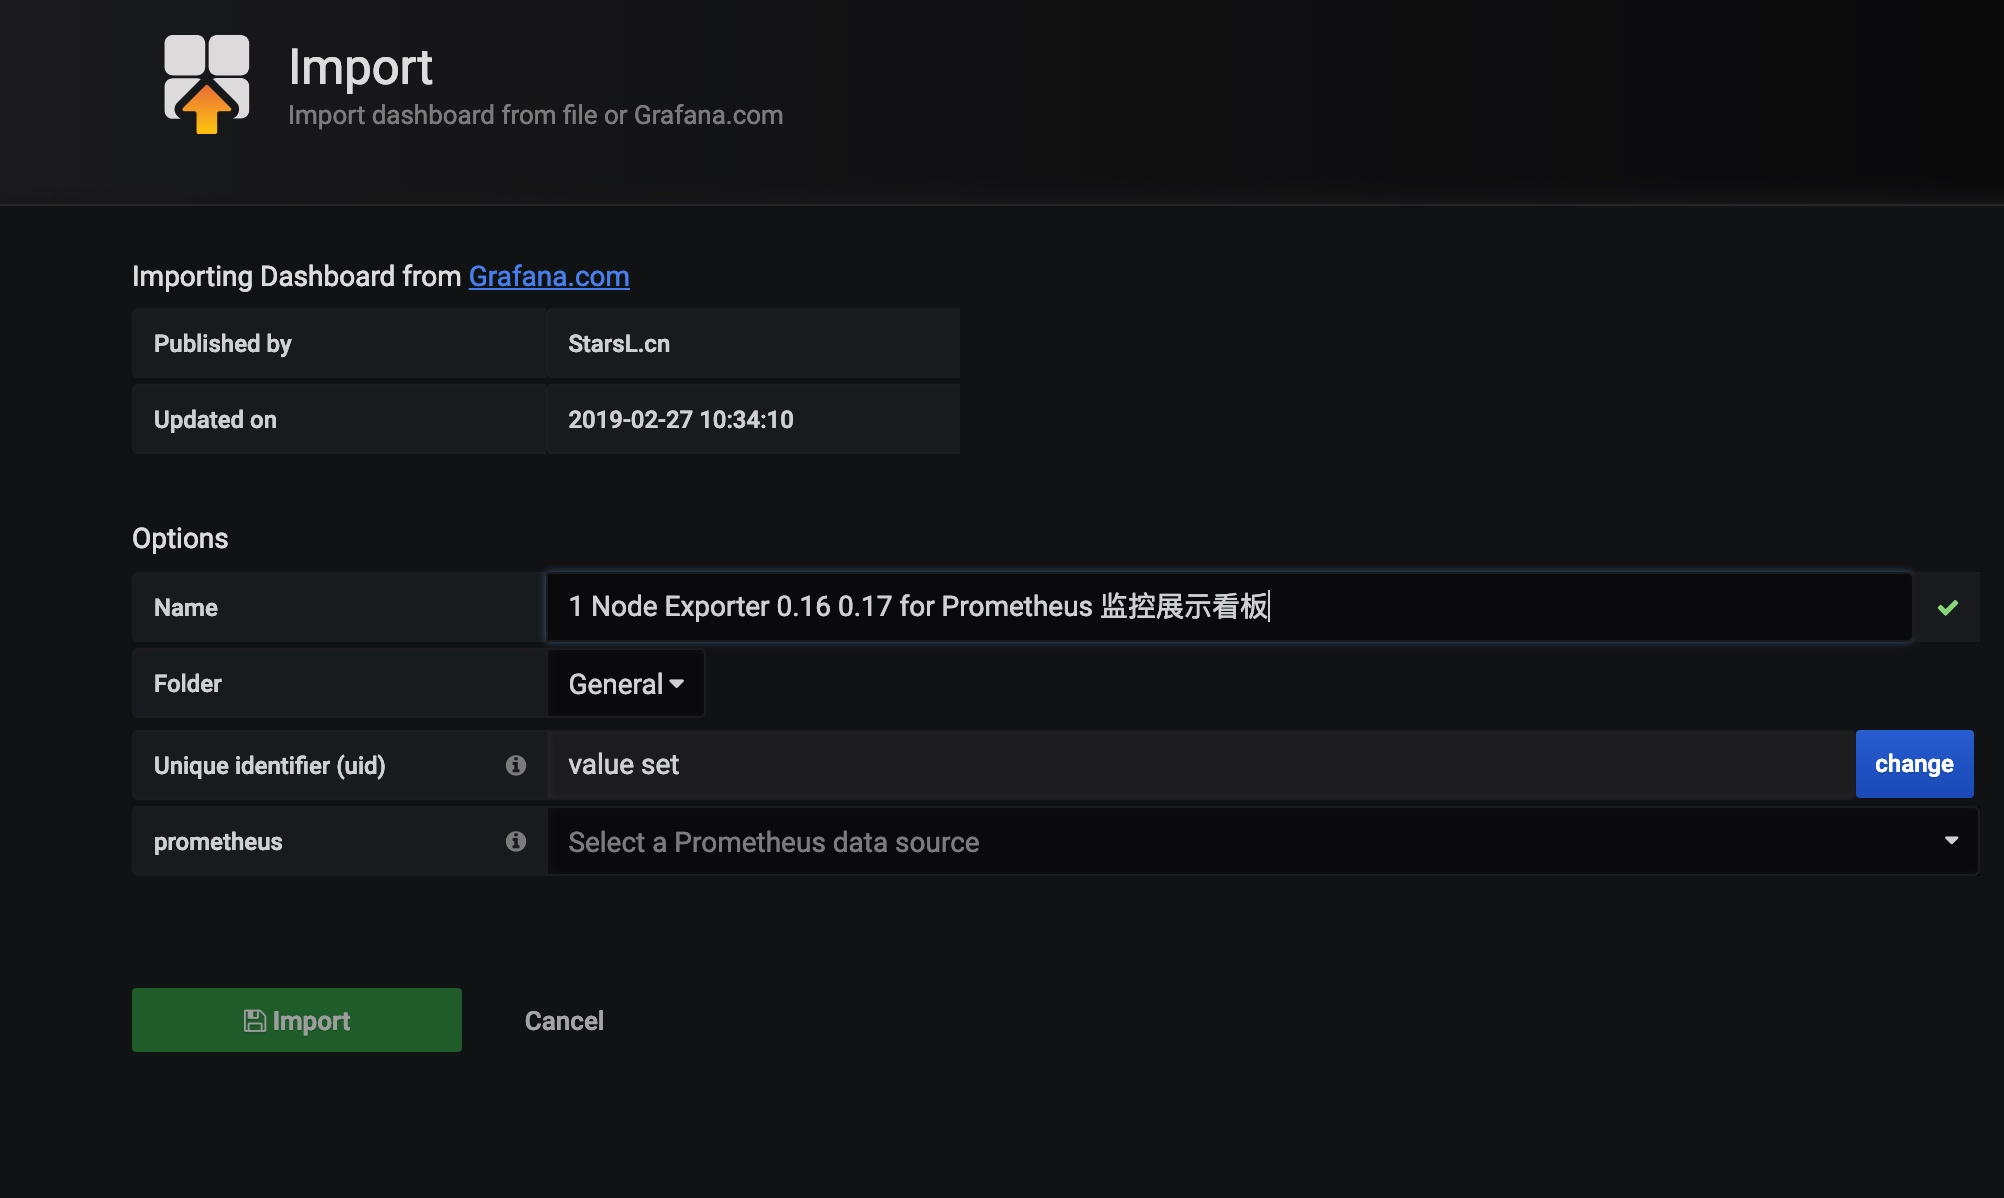
選擇prometheus的數據源,之後打開dashboard就可以看到漂亮的儀錶盤了
- AspNet Core 配置
參考 https://www.c-sharpcorner.com/article/reporting-metrics-to-prometheus-in-asp-net-core/
NuGet引用:prometheus-net.AspNetCore
public class Startup
{
    // others ...

    public void Configure(IApplicationBuilder app, IHostingEnvironment env)
    {
        // others ...

        app.UseMetricServer();
    }
}
啟動應用程式訪問 /metrics 出現以下頁面說明配置成功

例如,我們希望能夠統計每個API請求次數(200表示成功,500表示錯誤)。
public class RequestMiddleware
{
    private readonly RequestDelegate _next;
    private readonly ILogger _logger;

    public RequestMiddleware(
        RequestDelegate next
        , ILoggerFactory loggerFactory
        )
    {
        this._next = next;
        this._logger = loggerFactory.CreateLogger<RequestMiddleware>();
    }

    public async Task Invoke(HttpContext httpContext)
    {
        var path = httpContext.Request.Path.Value;
        var method = httpContext.Request.Method;

        var counter = Metrics.CreateCounter("prometheus_demo_request_total", "HTTP Requests Total", new CounterConfiguration
        {
            LabelNames = new[] { "path", "method", "status" }
        });

        var statusCode = 200;

        try
        {
            await _next.Invoke(httpContext);
        }
        catch (Exception)
        {
            statusCode = 500;
            counter.Labels(path, method, statusCode.ToString()).Inc();

            throw;
        }

        if (path != "/metrics")
        {
            statusCode = httpContext.Response.StatusCode;
            counter.Labels(path, method, statusCode.ToString()).Inc();
        }
    }
}

public static class RequestMiddlewareExtensions
{
    public static IApplicationBuilder UseRequestMiddleware(this IApplicationBuilder builder)
    {
        return builder.UseMiddleware<RequestMiddleware>();
    }
}
修改Startup
public void Configure(IApplicationBuilder app, IHostingEnvironment env)
{
    // others ...

    app.UseMetricServer();

    app.UseRequestMiddleware();
}
修改api代碼
[HttpGet]
public ActionResult<IEnumerable<string>> Get()
{
    if(new System.Random().NextDouble() > 0.5)
    {
        throw new System.Exception("test exception");
    }

    return new string[] { "value1", "value2" };
}

然後在prometheus.yml添加配置
scrape_configs:
- job_name: mydemo
  scrape_interval: 15s
  scrape_timeout: 10s
  metrics_path: /metrics
  scheme: http
  static_configs:
  - targets:
    - localhost:44363
- Grafana集成到自己的Web項目
Web項目中我使用iframe直接嵌套進去的

但是瀏覽器緩存清除了或者session失效了,每次進入Web頁面看Grafana的時候就需要重新登錄,在官方社區查找,並沒有太好的執行辦法,最後決定把Grafana設置成匿名登錄:
修改conf/ custom.ini目錄下的預設配置文件內容:
找到:# enable anonymous access
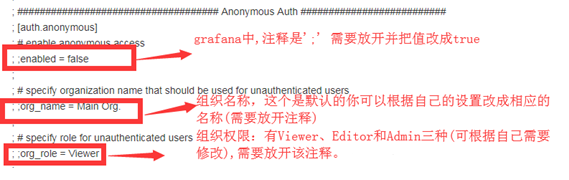
然後重啟grafana服務(systemctl restart grafana-server)就可以。
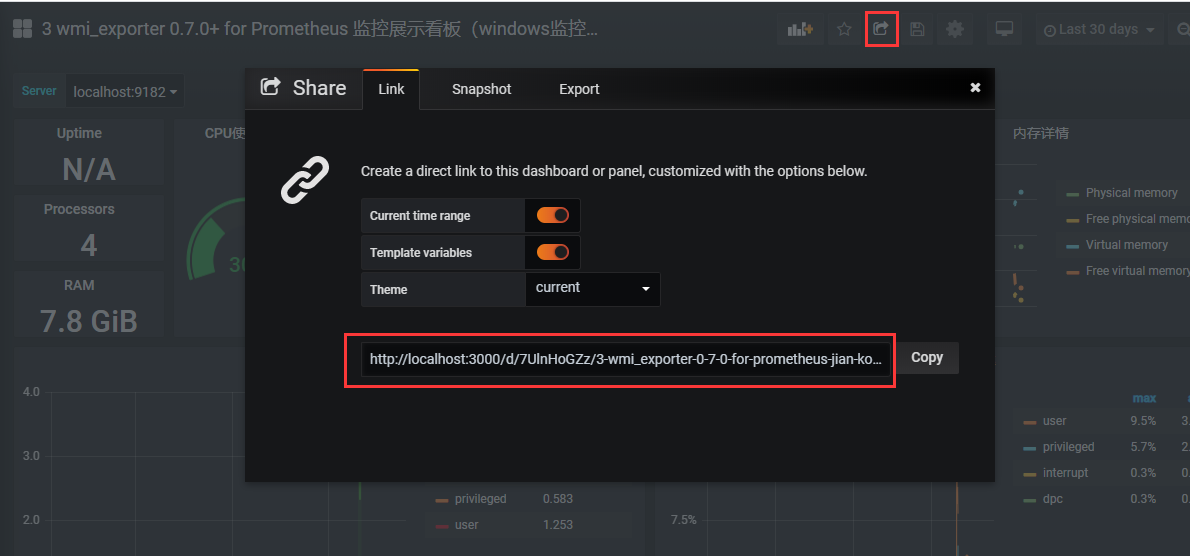
- Grafana分享集成