
使用 QCustomPlot 繪圖庫輔助開發時整理的學習筆記。本篇介紹如何使用 QCustomPlot 繪製 x-y 曲線圖,需要 x 軸數據與 y 軸數據都已知,示例中使用的 QCustomPlot 版本為 Version 2.1.1,QT 版本為 5.9.2。 ...
說明
使用 QCustomPlot 繪圖庫輔助開發時整理的學習筆記。同系列文章目錄可見 《繪圖庫 QCustomPlot 學習筆記》目錄。本篇介紹如何使用 QCustomPlot 繪製 x-y 曲線圖,需要 x 軸數據與 y 軸數據都已知,示例中使用的 QCustomPlot 版本為 Version 2.1.1,QT 版本為 5.9.2。
1. 示例工程配置
通過包含源碼的方式來使用 QCustomPlot 繪圖庫,方法詳見本人同系列文章 使用方法(源碼方式)。此外,庫官網有提供繪圖的示例代碼,詳見 QCustomPlot - Introduction,下載壓縮包 QCustomPlot.tar.gz 中也有示例的工程代碼,詳見同系列文章 下載。下麵示例中所用的工程文件(demoQCP.pro)內容為:
QT       += core gui
greaterThan(QT_MAJOR_VERSION, 4): QT += widgets printsupport

greaterThan(QT_MAJOR_VERSION, 4): CONFIG += c++11
lessThan(QT_MAJOR_VERSION, 5): QMAKE_CXXFLAGS += -std=c++11

TARGET = demoQCP
TEMPLATE = app

SOURCES += main.cpp\
           qcustomplot.cpp

HEADERS  += qcustomplot.h
實際使用 QCustomPlot 進行繪圖時,通常是將 UI 界面中的某個 QWidget 控制項提升為 QCustomPlot,然後以指針的方式調用 QCustomPlot 的類方法繪製圖像。這一方式用在示例中有點繁瑣(需要 .ui 文件),為了突出示例重點,減少文件依賴,示例代碼直接在 main.cpp 中聲明瞭一個 QCustomPlot 對象,示例工程所需的文件如下,只需四個文件,demoQCP.pro 的文件內容已在上面給出,main.cpp 的文件內容會在後面給出,qcustomplot.h 與 qcustomplot.cpp 兩個文件下載自官網。

main.cpp 文件的框架如下,demoPlot() 裡面用來寫繪圖的示例代碼。
#include <QApplication>
#include <QMainWindow>
#include "qcustomplot.h"

void demoPlot(QCustomPlot *customPlot)
{
    // 繪圖示例代碼
}

int main(int argc, char *argv[])
{
    QApplication a(argc, argv);
    QMainWindow window;

    // 將QCustomPlot視窗作為QMainWindow中心視窗
    QCustomPlot customPlot;
    window.setCentralWidget(&customPlot);

    // 繪圖
    demoPlot(&customPlot);

    // 顯示
    window.setWindowTitle(QStringLiteral("x-y 曲線圖示例 @木三百川"));
    window.setGeometry(100, 100, 800, 600);
    window.show();

    return a.exec();
}
關於繪圖顏色、線型、字體、網格線等外觀上的美化,會在本人同系列文章 《繪圖庫 QCustomPlot 學習筆記》目錄 中再做介紹,想學習的不妨關註一下。本文章只介紹繪製 x-y 曲線圖的基礎方法。
2. 常用 API 介紹
繪製 x-y 曲線圖所使用的類為 QCPGraph,它提供的類方法可在 Documentation - QCPGraph 中找到。常用的介面有以下幾個:
// 重置/添加繪圖數據的介面
void setData(const QVector<double> &keys, const QVector<double> &values, bool alreadySorted=false)
void addData(const QVector<double> &keys, const QVector<double> &values, bool alreadySorted=false)
void addData(double key, double value)

// 設置線型
void setLineStyle(LineStyle ls)

// 設置點型
void setScatterStyle(const QCPScatterStyle &style)
3. 繪製一條 x-y 曲線
demoPlot() 函數如下:
void demoPlot(QCustomPlot *customPlot)
{
    // 顯示上方橫軸(xAxis2)與右方縱軸(yAxis2),並與xAxis/yAxis保持同步
    customPlot->axisRect()->setupFullAxesBox(true);

    // 生成x-y數據, y=x^2, 定義域[-1,1]
    QVector<double> x(101), y(101);
    for (int i = 0; i < 101; ++i)
    {
        x[i] = i/50.0 - 1;
        y[i] = x[i]*x[i];
    }

    // 新建QCPGraph對象,並設置繪圖數據
    customPlot->addGraph();
    customPlot->graph(0)->setData(x, y);

    // 設置標題
    customPlot->plotLayout()->insertRow(0);
    customPlot->plotLayout()->addElement(0, 0, new QCPTextElement(customPlot, "Test-Title", QFont("sans", 17, QFont::Bold)));

    // 設置坐標軸標簽
    customPlot->xAxis->setLabel("x");
    customPlot->yAxis->setLabel("y");

    // 設置坐標軸範圍
    customPlot->xAxis->setRange(-1, 1);
    customPlot->yAxis->setRange(0, 1);

    // 刷新顯示
    customPlot->replot();
}
繪製效果:

4. 繪製多條 x-y 曲線
demoPlot() 函數如下:
void demoPlot(QCustomPlot *customPlot)
{
    // 顯示上方橫軸(xAxis2)與右方縱軸(yAxis2),並與xAxis/yAxis保持同步
    customPlot->axisRect()->setupFullAxesBox(true);

    // 生成x-y數據,y1=x^2,y2=x^3,定義域[-1,1]
    QVector<double> x(101), y1(101), y2(101);
    for (int i = 0; i < 101; ++i)
    {
        x[i] = i/50.0 - 1;
        y1[i] = x[i]*x[i];
        y2[i] = x[i]*x[i]*x[i];
    }

    // 新建QCPGraph對象,並設置繪圖數據x-y1
    customPlot->addGraph();
    customPlot->graph(0)->setPen(QPen(Qt::blue));
    customPlot->graph(0)->setData(x, y1);
    customPlot->graph(0)->setName(QStringLiteral("二次曲線圖例"));

    // 新建QCPGraph對象,並設置繪圖數據x-y2
    customPlot->addGraph();
    customPlot->graph(1)->setPen(QPen(Qt::red));
    customPlot->graph(1)->setData(x, y2);
    customPlot->graph(1)->setName(QStringLiteral("三次曲線圖例"));

    // 顯示圖例
    customPlot->legend->setVisible(true);

    // 設置標題
    customPlot->plotLayout()->insertRow(0);
    customPlot->plotLayout()->addElement(0, 0, new QCPTextElement(customPlot, "Test-Title", QFont("sans", 17, QFont::Bold)));

    // 設置坐標軸標簽
    customPlot->xAxis->setLabel("x");
    customPlot->yAxis->setLabel("y");

    // 設置坐標軸範圍
    customPlot->xAxis->setRange(-1, 1);
    customPlot->yAxis->setRange(-1, 1);

    // 刷新顯示
    customPlot->replot();
}
繪製效果:

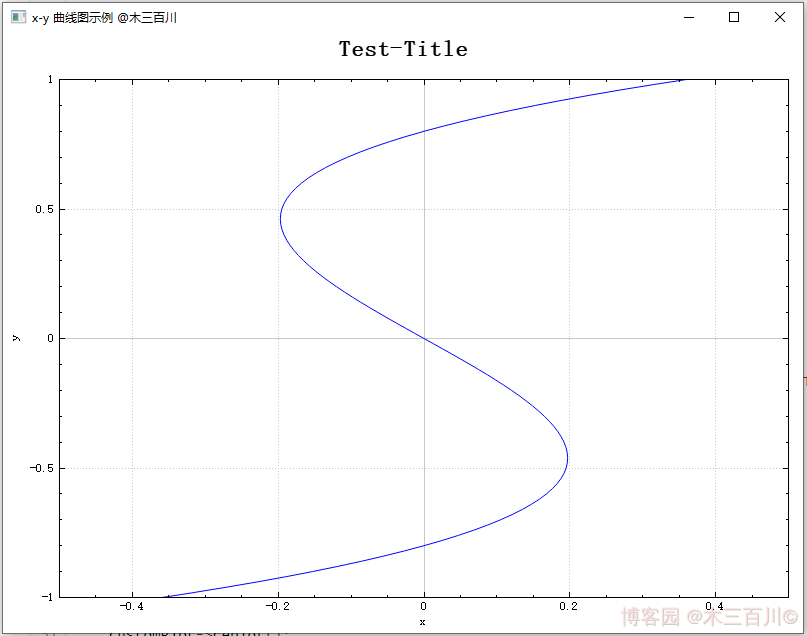
5. 繪製往回走的 x-y 曲線
舉個例子,若需要繪製 \(x=(y+0.8)\times y\times (y-0.8),y\in [-1,1]\) 曲線,有三種方法:
- 方法一:新建
QCPGraph對象時,指定yAxis為keyAxis,指定xAxis為valueAxis,即互換一下坐標軸的角色,這是最靠譜也最常用的方法。 - 方法二:仍以
xAxis為keyAxis、yAxis為valueAxis(預設情況),但在調用setData()時,需傳入第三個參數true。這是一種偷懶的做法,並且繪圖的橫軸數據(keyAxis)需滿足一定的條件:keyData必須先遞增再減小、且減小時不得離keyData[0]太近,否則繪圖會出錯。 - 方法三:導出繪圖數據的記憶體地址,直接將數據寫入記憶體中,這種做法常被用來提升 QCustomPlot 性能,縮短數據更新時間,但用此來繪製往回走的 x-y 曲線時,繪圖的橫軸數據也需要滿足上面的條件,否則繪圖會出錯。
當曲線形成的環路很複雜時,一般採用繪製參數曲線的方法來表現,詳見 Documentation - QCPCurve 或本人同系列文章。
5.1 靠譜方法:互換 x-y 軸
demoPlot() 函數如下:
void demoPlot(QCustomPlot *customPlot)
{
    // 顯示上方橫軸(xAxis2)與右方縱軸(yAxis2),並與xAxis/yAxis保持同步
    customPlot->axisRect()->setupFullAxesBox(true);

    // 生成y-x數據, x=(y+0.8)*y*(y-0.8), 定義域[-1,1]
    QVector<double> x(101), y(101);
    for (int i = 0; i < 101; ++i)
    {
        y[i] = i/50.0 - 1;
        x[i] = (y[i]+0.8)*y[i]*(y[i]-0.8);
    }

    // 新建QCPGraph對象(互換xAxis/yAxis),並設置繪圖數據
    customPlot->addGraph(customPlot->yAxis, customPlot->xAxis);
    customPlot->graph(0)->setData(y, x);

    // 設置標題
    customPlot->plotLayout()->insertRow(0);
    customPlot->plotLayout()->addElement(0, 0, new QCPTextElement(customPlot, "Test-Title", QFont("sans", 17, QFont::Bold)));

    // 設置坐標軸標簽
    customPlot->xAxis->setLabel("x");
    customPlot->yAxis->setLabel("y");

    // 設置坐標軸範圍
    customPlot->xAxis->setRange(-0.5, 0.5);
    customPlot->yAxis->setRange(-1, 1);

    // 刷新顯示
    customPlot->replot();
}
繪製效果:

5.2 偷懶方法:設置 alreadySorted = true
demoPlot() 函數如下:
void demoPlot(QCustomPlot *customPlot)
{
    // 顯示上方橫軸(xAxis2)與右方縱軸(yAxis2),並與xAxis/yAxis保持同步
    customPlot->axisRect()->setupFullAxesBox(true);

    // 生成y-x數據, x=(y+0.8)*y*(y-0.8), 定義域[-1,1]
    QVector<double> x(101), y(101);
    for (int i = 0; i < 101; ++i)
    {
        y[i] = i/50.0 - 1;
        x[i] = (y[i]+0.8)*y[i]*(y[i]-0.8);
    }

    // 新建QCPGraph對象,並設置繪圖數據以及 alreadySorted = true
    customPlot->addGraph();
    customPlot->graph(0)->setData(x, y, true);

    // 設置標題
    customPlot->plotLayout()->insertRow(0);
    customPlot->plotLayout()->addElement(0, 0, new QCPTextElement(customPlot, "Test-Title", QFont("sans", 17, QFont::Bold)));

    // 設置坐標軸標簽
    customPlot->xAxis->setLabel("x");
    customPlot->yAxis->setLabel("y");

    // 設置坐標軸範圍
    customPlot->xAxis->setRange(-0.5, 0.5);
    customPlot->yAxis->setRange(-1, 1);

    // 刷新顯示
    customPlot->replot();
}
繪製效果:

註意這張圖中,keyData (橫軸)滿足先遞增再減小、且減小時的最小值(約為 -0.197)大於 keyData[0](約為 -0.360),所以繪製沒有出錯。有興趣的可以嘗試一下,當橫軸數據減小且比較接近 keyData[0] 時,繪製的效果。
5.3 備用方法:導出繪圖數據記憶體地址
關於如何導出一維繪圖數據的記憶體地址,詳見本人另一篇文章 【QCustomPlot】性能提升之修改源碼(版本 V2.x.x)。demoPlot() 函數如下:
void demoPlot(QCustomPlot *customPlot)
{
    // 顯示上方橫軸(xAxis2)與右方縱軸(yAxis2),並與xAxis/yAxis保持同步
    customPlot->axisRect()->setupFullAxesBox(true);

    // 新建QCPGraph對象,獲得繪圖數據的記憶體地址,並設置繪圖數據
    customPlot->addGraph();
    QVector<QCPGraphData> *mData = customPlot->graph(0)->data()->coreData();
    mData->reserve(101);
    mData->resize(101);
    for (int i = 0; i < 101; ++i)
    {
        double y = i/50.0 - 1;
        (*mData)[i].key = (y+0.8)*y*(y-0.8);
        (*mData)[i].value = y;
    }

    // 設置標題
    customPlot->plotLayout()->insertRow(0);
    customPlot->plotLayout()->addElement(0, 0, new QCPTextElement(customPlot, "Test-Title", QFont("sans", 17, QFont::Bold)));

    // 設置坐標軸標簽
    customPlot->xAxis->setLabel("x");
    customPlot->yAxis->setLabel("y");

    // 設置坐標軸範圍
    customPlot->xAxis->setRange(-0.5, 0.5);
    customPlot->yAxis->setRange(-1, 1);

    // 刷新顯示
    customPlot->replot();
}
繪製效果:
6. 繪製間隙中斷的 x-y 曲線
當 keyAxis 數據中存在 NaN 時,繪製曲線會出現間隙中斷的效果,demoPlot() 函數如下:
void demoPlot(QCustomPlot *customPlot)
{
    // 顯示上方橫軸(xAxis2)與右方縱軸(yAxis2),並與xAxis/yAxis保持同步
    customPlot->axisRect()->setupFullAxesBox(true);

    // 生成x-y數據, y=x^2, 定義域[-1,1]
    QVector<double> x(101), y(101);
    for (int i = 0; i < 101; ++i)
    {
        x[i] = i/50.0 - 1;
        y[i] = x[i]*x[i];
    }
    y[30] = qQNaN();
    y[60] = std::numeric_limits<double>::quiet_NaN();

    // 新建QCPGraph對象,並設置繪圖數據
    customPlot->addGraph();
    customPlot->graph(0)->setData(x, y);

    // 設置標題
    customPlot->plotLayout()->insertRow(0);
    customPlot->plotLayout()->addElement(0, 0, new QCPTextElement(customPlot, "Test-Title", QFont("sans", 17, QFont::Bold)));

    // 設置坐標軸標簽
    customPlot->xAxis->setLabel("x");
    customPlot->yAxis->setLabel("y");

    // 設置坐標軸範圍
    customPlot->xAxis->setRange(-1, 1);
    customPlot->yAxis->setRange(0, 1);

    // 刷新顯示
    customPlot->replot();
}
繪製效果:

本文作者:木三百川
本文鏈接:https://www.cnblogs.com/young520/p/17492537.html
版權聲明:本文系博主原創文章,著作權歸作者所有。商業轉載請聯繫作者獲得授權,非商業轉載請附上出處鏈接。遵循 署名-非商業性使用-相同方式共用 4.0 國際版 (CC BY-NC-SA 4.0) 版權協議。