一、繪製矩形 1、rect (x, y, width, height) : 繪製矩形的路徑 用軌跡畫的,不是獨立路徑( 沒有beginPath() ) 需要stroke()描邊才會顯示 2、strokeRect (x, y, width, height) : 描邊矩形 自動描邊,有獨立路徑 3、fi ...
一、繪製矩形
1、rect (x, y, width, height) : 繪製矩形的路徑
---用軌跡畫的,不是獨立路徑( 沒有beginPath() )
---需要stroke()描邊才會顯示
2、strokeRect (x, y, width, height) : 描邊矩形
---自動描邊,有獨立路徑
3、fillRect (x, y, width, height) : 填充矩形
---自動填充(預設黑色),有獨立路徑
4、clearRect (x, y, width, height) : 清除矩形
---相當於橡皮擦
      var myCanvas = document.querySelector("canvas");
      var ctx = myCanvas.getContext("2d");
      ctx.fillRect(100, 100, 300, 200);
      ctx.clearRect(100,100,50,50);
如下圖:

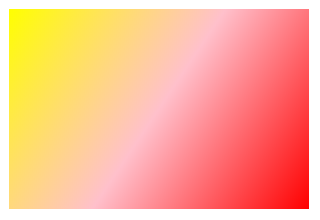
5、繪製漸變矩形
---與css3差不多,漸變三要素 : 方向(有起始坐標, 結束坐標) 初始顏色 結束顏色
      var myCanvas = document.querySelector("canvas");
      var ctx = myCanvas.getContext("2d");
      var linearGradient = ctx.createLinearGradient(100, 100, 400, 300);
      linearGradient.addColorStop(0, 'yellow');
      linearGradient.addColorStop(.5, 'pink');
      linearGradient.addColorStop(1, 'red');
      ctx.fillStyle = linearGradient;
      ctx.fillRect(100, 100, 300, 200);
如下圖:
二、繪製扇形
1、圓弧
(1)什麼是弧度???
--- 一種長度的描述單位
--- 一弧度的長等於圓的半徑的長
--- 一個圓有 2π個弧度
--- 一個角度等於 π / 180 個弧度
--- 90度等於 π / 2個弧度
2、繪製圓弧
(1)確定圓心(坐標)
(2)確定半徑
(3)確定 起始繪製 和 結束繪製 的位置 ,弧的位置 --- startAngle , endAngle
(4)確定繪製的方向,預設是順時針(false),逆時針(true)
(5)繪製圓弧的函數 ctx.arc(x, y, radius, startAngle, endAngle, anticlockwise)
例:在中心位置畫一個半徑為150px的圓弧 ,0度到90度位置的圓弧
    var w = ctx.canvas.width;
    var h = ctx.canvas.height;
    ctx.arc(x / 2, h / 2, 150, 0 , Math.PI / 2);
    ctx.stroke();
3、繪製扇形
        //第一種
        //先移動原點到中心點
        ctx.moveTo(w / 2, h / 2);
        //繪製圓弧時其實繪製了兩條軌跡
        ctx.arc(w / 2, h / 2, 150, Math.PI / 2, Math.PI);
        //閉合路徑
        ctx.closrPath();
        ctx.stroke();


        //第二種
        //先繪製圓弧
        ctx.arc(w / 2, h / 2, 150, Math.PI / 2, Math.PI);
        //繪製一條到中心點的軌跡
        ctx.lineTo(w / 2,  h / 2);
        //閉合路徑
        ctx.closePath();
        ctx.stroke();
三、繪製n等分的隨機顏色的圓
         var myCanvas = document.querySelector("canvas");
          var ctx = myCanvas.getContext("2d");
       //確認中心點X
          var x0 = ctx.canvas.width / 2;
       //確認中心點Y
          var h0 = ctx.canvas.height / 2;
       //繪製多少個扇形
          var num = 6;
       //獲取扇形的角度
          var angle = 2 * Math.PI / num;
       //隨機顏色函數
          var randomColor = function(){
            var r = Math.floor(Math.random() * 256);
            var g = Math.floor(Math.random() * 256);
            var b = Math.floor(Math.random() * 256);
            return "rgb("+r+","+g+","+b+")";
          }

          for(var i = 0; i < num; i++){
        //獲取每一次的起始位置
            var stratAngle = i * angle;
        //獲取每一次的結束位置
            var endAngle = (i + 1) * angle;
            ctx.beginPath();
            ctx.moveTo(x0, h0);
            ctx.arc(x0, h0, 150, stratAngle, endAngle);
            ctx.fillStyle = randomColor();
            ctx.fill();
          }
四、繪製帶數據的餅圖
        var myCanvas = document.querySelector("canvas");
        var ctx = myCanvas.getContext("2d");
        var x0 = ctx.canvas.width / 2;
        var y0 = ctx.canvas.height / 2;
        // 自定義了四個數組
        var data = [8,30,19,12];
        var angleList = [];
        var total = 0;
        data.forEach(function(item,i){
          total += item;
          if(i == data.length -1){
            angleList.push(2 * Math.PI * (data[0] / total));
          }
        });
        // 計算4個數據分別占弧度的比例,加入angleList中
        data.forEach(function(item,i){
          if(i >= 1){
            angleList.push(2 * Math.PI * (item / total));
          }
        })

        var randomColor = function(){
            var r = Math.floor(Math.random() * 256);
            var g = Math.floor(Math.random() * 256);
            var b = Math.floor(Math.random() * 256);
            return "rgb("+r+","+g+","+b+")";
          }
        // 開始弧度
        var startAngle = 0;
        angleList.forEach(function(item,i){
          // 結束弧度是開始弧度加上新的弧度
          var endAngle = startAngle + item;
          ctx.beginPath();
          ctx.moveTo(x0, y0);
          ctx.arc(x0, y0, 150, startAngle, endAngle);
          ctx.fillStyle = randomColor();
          ctx.fill();
          // 開始弧度是上一次的結束弧度
          startAngle = endAngle;
        })
五、畫布中繪製文字
1、 strokeText (str, x, y) : 繪製描邊文本
2、fillText(str, x, y) : 繪製填充文本
註:起始坐標位於左下角
3、font = ‘ size, family‘ : 設置文本的大小和字體(第一個參數是大小,第二個參數是字體)
例:ctx.font = ' 40px, Microsoft YaHei ' ;
4、textAlign = left, center, right, start(預設), end : 設置文本水平方向的對齊方式
5、textBaseline = top , middle, bottom : 設置文本垂直方向的對齊方式
6、measureText(str) :獲取文本的寬度
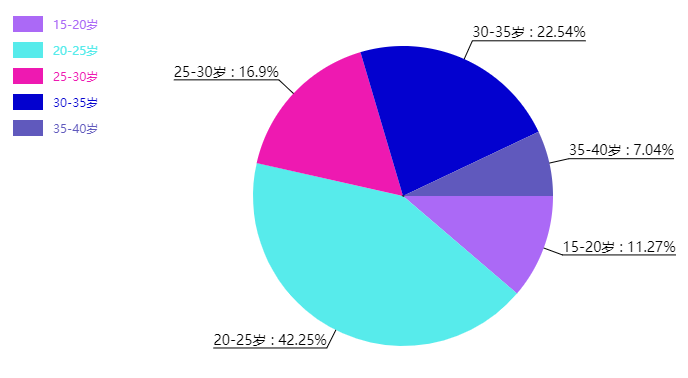
六、繪製餅圖加標題和說明
---繪製完餅圖,別人根本看不懂那一塊是那一塊,所以需要加上標題和說明
---從扇形的弧中間伸出一條線,在畫一條橫線,在橫線上寫上文字標題
---在畫布的左上角,繪製一個和扇形一樣顏色的矩形說明,旁邊附上文字說明
如:
1、繪製扇形中間伸出來的線
1.1---如何確定這條線的位置 :兩點確定一條 —— 中心點和線末端的點
1.2---如何確定末端的點 :
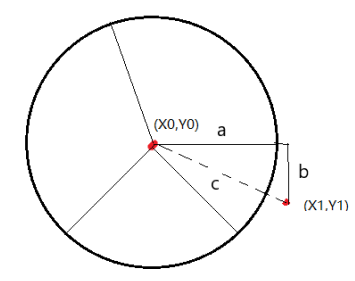
如上圖:可以把它看成一個直角三角形,則 X1 = X0 + a ; Y1 = Y0 + b ;
1.3---那麼又如何確定 a 和 b 的長度呢?
這時需要用到三角函數的勾股定理,看下圖:

已知 c = 1, 則 a = cos ( 30° ) * c
b = sin ( 30° ) * c
1.4---現在知道了 a 和 b 怎麼求了,那麼弧度又如何求呢?
由前面知道了弧度等於 比例 * 2π
而這裡的弧度等於 : 開始弧度 + 當前弧度 / 2;
startAnglr + angle / 2;
所以 X1 = X0 + cos( startAngle + angle / 2 ) * radius
Y1 = X0 + sin( startAngle + angle / 2 ) * radius
1.5---代碼
// 創建餅圖對象
        var PieChart = function(cavs){
        this.ctx = document.querySelector("canvas").getContext("2d");
        this.x0 = this.ctx.canvas.width / 2 + 60;
        this.y0 = this.ctx.canvas.height / 2;
        // 半徑
        this.radius = 150;
        // 標題伸出去的線的長度
        this.outLine = 20 + this.radius;
        // 說明矩形的寬
        this.rectW = 30;
        // 說明矩形的高
        this.rectH = 16;
        // 說明矩形的左間距
        this.space = 20;
      }
      // 初始化
      PieChart.prototype.init = function(data){
        this.drawPie(data);
      }
      // 繪製餅圖函數
      PieChart.prototype.drawPie = function(data){
        var that = this;
        // 獲取帶有數據的數組,其中包含num,title,angle,ratio
        var angleList = this.transfromAngle(data);
        var startAngle = 0;
        angleList.forEach(function(item,i){
          // 結束弧度等於開始弧度加上當前弧度
          var endAngle = startAngle + item.angle;
          //繪製標題
          that.drawTitle(startAngle,item.angle,item.title,item.ratio);

          that.ctx.beginPath();
          that.ctx.moveTo(that.x0, that.y0);
          that.ctx.arc(that.x0, that.y0, that.radius, startAngle, endAngle);
          that.ctx.fillStyle = that.getRandomColor();
          that.ctx.fill();
          // 繪製說明
          that.drawDescription(i,item.title);
          // 開始弧度等於上一次的結束弧度
          startAngle = endAngle;
        })
      }
      // 繪製標題函數
      PieChart.prototype.drawTitle = function(startAngle,angle,title,ratio){
          // 獲取X方向線的長度,可以理解為a的長度
          var outXLine = Math.cos(startAngle + angle / 2) * this.outLine;
          // 獲取Y方向線的長度,可以理解為b的長度
          var outYLine = Math.sin(startAngle + angle / 2) * this.outLine;
          // 獲取末端點X坐標
          var outX = this.x0 + outXLine;
          // 獲取末端點Y坐標
          var outY = this.y0 + outYLine;
          // 設置標題為 title加上ratio
          var str = title+" : "+ratio;
          this.ctx.beginPath();
          this.ctx.moveTo(this.x0, this.y0);
          this.ctx.lineTo(outX, outY);
          // 設置標題垂直方向底線對齊
          this.ctx.textBaseline = "bottom";
          // 設置標題字體大小和字體
          this.ctx.font = "14px Microsoft YaHei";
          // 設置標題顏色
          this.ctx.fillStyle = "#000";
          // 如果末端點在中心點的右邊,則橫線向右,否則向左
          if(outX >= this.x0){
            this.ctx.lineTo(outX + this.ctx.measureText(str).width, outY);
            this.ctx.textAlign = 'left';
          }else{
            this.ctx.lineTo(outX - this.ctx.measureText(str).width, outY);
            // 設置文字水平對齊基於起始點的右邊
            this.ctx.textAlign = 'right';
          }
          // 設置字體
          this.ctx.fillText(str, outX, outY);
          this.ctx.stroke();
      }
      PieChart.prototype.drawDescription = function(index,title){
        // 1、矩形的大小
        // 2、上邊和左邊的間距
        // 3、矩形之間的間距
        this.ctx.fillRect(this.space, this.space + index * (10 + this.rectH), this.rectW, this.rectH);
        this.ctx.beginPath();
        this.ctx.textAlign = "left";
        this.ctx.textBaseline = "top";
        this.ctx.font = "12px Microsoft YaHei";
        this.ctx.fillText(title, this.space + this.rectW + 10, this.space + index * (10 + this.rectH) + this.rectH / 4);
      }
      PieChart.prototype.transfromAngle = function(data){
          var total = 0;
          // 獲取數據總數
          data.forEach(function(item,i){
            total += item.num;
          })
          data.forEach(function(item,i){
            // 獲取弧度並存如data中
            item.angle = item.num / total * Math.PI * 2;
            // 獲取百分比並精確到小數點後兩位,存入data中
            item.ratio = Math.round(item.num / total * 10000) / 100 + "%";
          })
          return data;
      }
      PieChart.prototype.getRandomColor = function(){
        var r = Math.floor(Math.random() * 256);
        var g = Math.floor(Math.random() * 256);
        var b = Math.floor(Math.random() * 256);
        return "rgb("+r+","+g+","+b+")";
      }
      var data = [
        {
          num : 8,
          title : "15-20歲"
        },
        {
          num : 30,
          title : "20-25歲"
        },
        {
          num : 12,
          title : "25-30歲"
        },
        {
          num : 16,
          title : "30-35歲"
        },
        {
          num : 5,
          title : "35-40歲"
        },
      ];

      var pie = new PieChart();
      pie.init(data);