上一篇只是大概介紹了一下斷路器Hystrix Dashboard監控,如何使用Hystrix Dashboard監控微服務的狀態呢?這篇看看Ribbon如何整合斷路器監控Hystrix Dashboard。今天的項目主要整合sc-eureka-client-consumer-ribbon-hystr ...
上一篇只是大概介紹了一下斷路器Hystrix Dashboard監控,如何使用Hystrix Dashboard監控微服務的狀態呢?這篇看看Ribbon如何整合斷路器監控Hystrix Dashboard。今天的項目主要整合sc-eureka-client-consumer-ribbon-hystrix項目和sc-hystrix-dashboard項目
1、 新建項目sc-ribbon-hystrix-dashboard,對應的pom.xml文件
<project xmlns="http://maven.apache.org/POM/4.0.0" xmlns:xsi="http://www.w3.org/2001/XMLSchema-instance"
xsi:schemaLocation="http://maven.apache.org/POM/4.0.0 http://maven.apache.org/xsd/maven-4.0.0.xsd">
<modelVersion>4.0.0</modelVersion>
<groupId>spring-cloud</groupId>
<artifactId>sc-ribbon-hystrix-dashboard</artifactId>
<version>0.0.1-SNAPSHOT</version>
<packaging>jar</packaging>
<parent>
<groupId>org.springframework.boot</groupId>
<artifactId>spring-boot-starter-parent</artifactId>
<version>2.0.4.RELEASE</version>
</parent>
<dependencyManagement>
<dependencies>
<dependency>
<groupId>org.springframework.cloud</groupId>
<artifactId>spring-cloud-dependencies</artifactId>
<version>Finchley.RELEASE</version>
<type>pom</type>
<scope>import</scope>
</dependency>
</dependencies>
</dependencyManagement>
<properties>
<project.build.sourceEncoding>UTF-8</project.build.sourceEncoding>
<maven.compiler.source>1.8</maven.compiler.source>
<maven.compiler.target>1.8</maven.compiler.target>
</properties>
<dependencies>
<dependency>
<groupId>org.springframework.cloud</groupId>
<artifactId>spring-cloud-starter-netflix-eureka-client</artifactId>
</dependency>
<!-- <dependency>
<groupId>org.springframework.cloud</groupId>
<artifactId>spring-cloud-starter-ribbon</artifactId>
<version>1.4.5.RELEASE</version>
</dependency> -->
<dependency>
<groupId>org.springframework.cloud</groupId>
<artifactId>spring-cloud-starter-netflix-ribbon</artifactId>
</dependency>
<dependency>
<groupId>org.springframework.boot</groupId>
<artifactId>spring-boot-starter-web</artifactId>
</dependency>
<!--
<dependency>
<groupId>org.springframework.cloud</groupId>
<artifactId>spring-cloud-starter-hystrix</artifactId>
<version>1.4.5.RELEASE</version>
</dependency> -->
<dependency>
<groupId>org.springframework.cloud</groupId>
<artifactId>spring-cloud-starter-netflix-hystrix</artifactId>
</dependency>
<!-- <dependency>
<groupId>org.springframework.cloud</groupId>
<artifactId>spring-cloud-starter-hystrix-dashboard</artifactId>
<version>1.4.5.RELEASE</version>
</dependency> -->
<dependency>
<groupId>org.springframework.cloud</groupId>
<artifactId>spring-cloud-starter-netflix-hystrix-dashboard</artifactId>
</dependency>
<dependency>
<groupId>org.springframework.boot</groupId>
<artifactId>spring-boot-starter-actuator</artifactId>
</dependency>
</dependencies>
</project>
可以看到這個pom.xml文件是sc-eureka-client-consumer-ribbon-hstrix項目和sc-hystrix-dashboard項目的pom.xml的並集
2、 新建spring boot 啟動類HystrixDashboardApplication.java
package sc.consumer;
import org.springframework.boot.SpringApplication;
import org.springframework.boot.autoconfigure.SpringBootApplication;
import org.springframework.cloud.netflix.eureka.EnableEurekaClient;
import org.springframework.cloud.netflix.hystrix.EnableHystrix;
import org.springframework.cloud.netflix.hystrix.dashboard.EnableHystrixDashboard;
@SpringBootApplication
@EnableEurekaClient
@EnableHystrix
@EnableHystrixDashboard
public class HystrixDashboardApplication {
public static void main(String[] args) {
SpringApplication.run(HystrixDashboardApplication.class, args);
}
}
可以看到這個啟動類的註解也是sc-eureka-client-consumer-ribbon-hstrix項目和sc-hystrix-dashboard項目的啟動類的並集
3、 其他的java類就不多說了,項目介面如下

4、 分別啟動配置中心和sc-eureka-server和服務提供者sc-eureka-client-provider
5、 啟動項目sc-ribbon-hystrix-dashboard
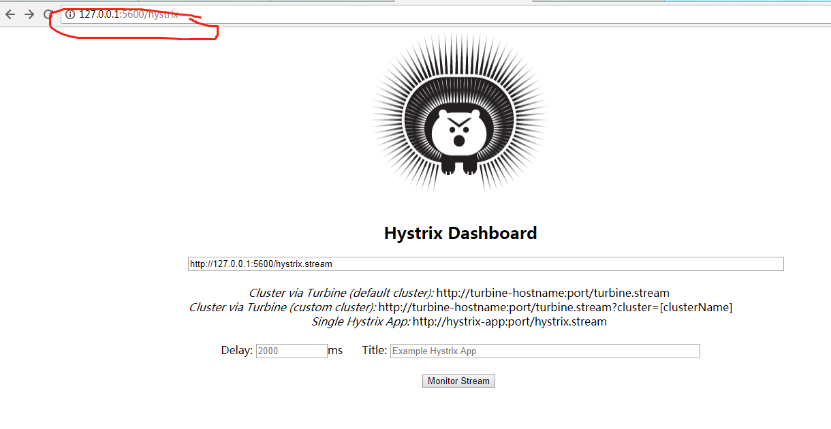
方式一:http://127.0.0.1:5600/hystrix驗證是否啟動成功
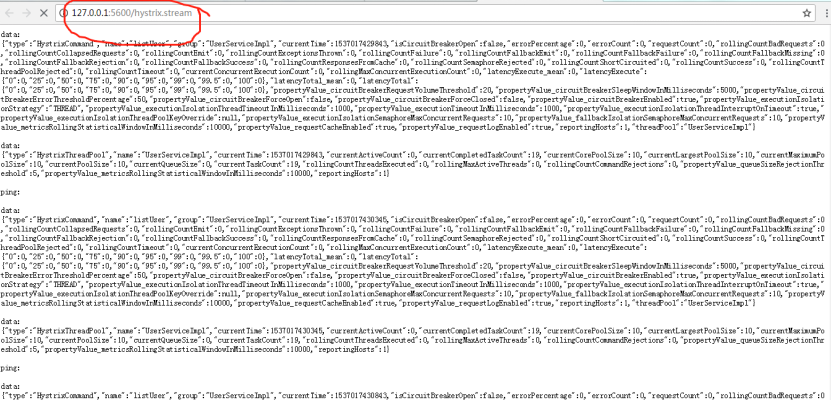
方式二:訪問http://127.0.0.1:5600/hystrix.stream
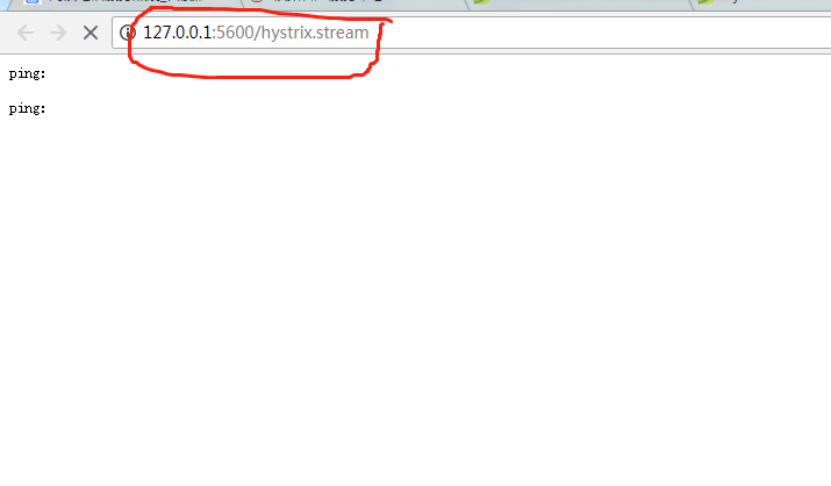
這個是訪問DashboardServletConfig.java這個servlet對應的地址
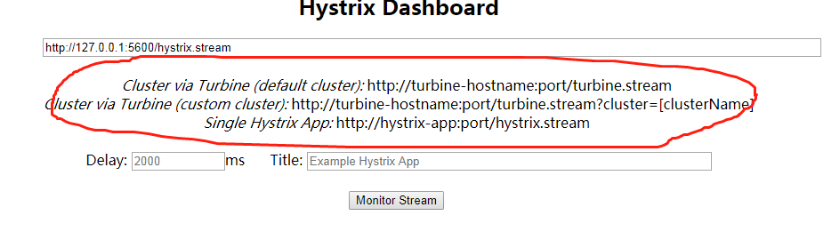
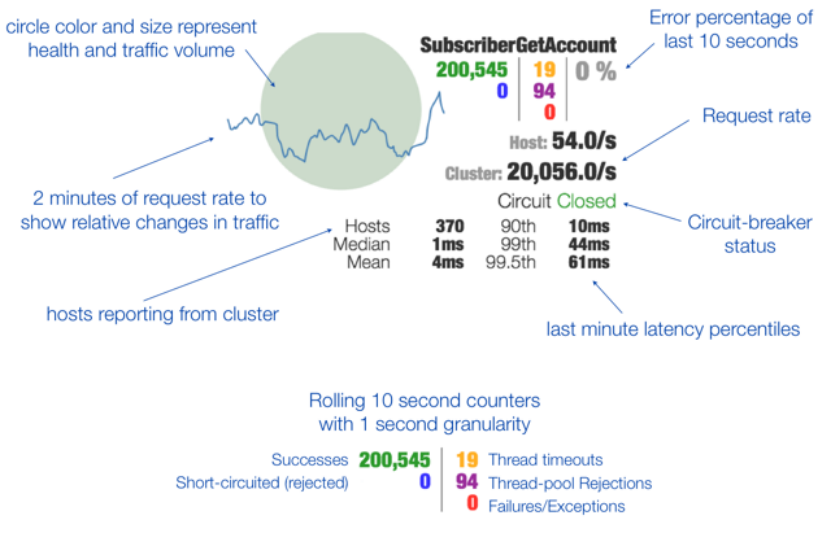
上篇說了一下下圖這段英文的大概意思
6、 演示一下單應用模式下的斷路器監控Hystrix Dashboard
在url里輸入:http://127.0.0.1:5600/hystrix.stream(IP和埠對應服務消費者的IP和埠)
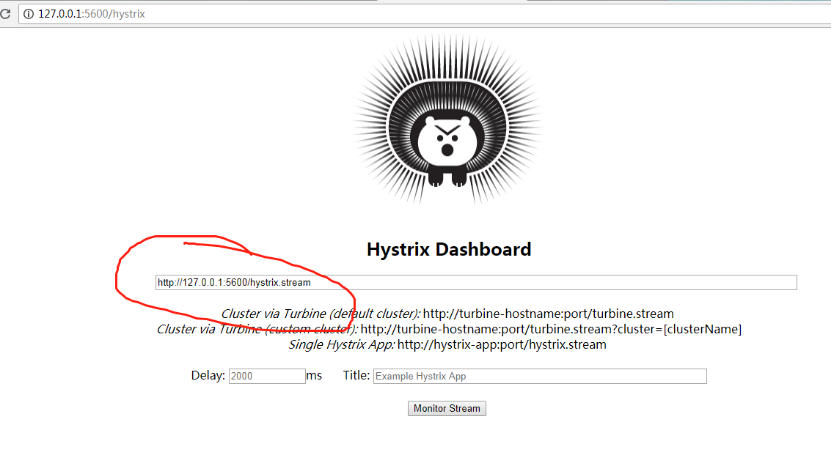
然後點擊Monitor Stream按鈕

7、 使用postman訪問任何介面,以獲取用戶列表為例(http://127.0.0.1:5600/cli/user/listUser),多訪問幾次在查看對應的監控界面

發現監控界面的圖出現了動態變化,這個就是對服務調用的監控。圖中相關單元的含義可以查看:
https://github.com/Netflix-Skunkworks/hystrix-dashboard/wiki
http://127.0.0.1:5600/hystrix.stream對應的界面也出現了大量數據,這個也是對服務調用監控的數據。
其他介面也自行測試。