安裝Prometheus wget https://github.com/prometheus/prometheus/releases/download/v2.34.0/prometheus-2.34.0.linux-amd64.tar.gz tar -zxvf prometheus-2.34.0. ...
安裝Prometheus
tar -zxvf prometheus-2.34.0.linux-amd64.tar.gz
mv prometheus-2.34.0.linux-amd64 prometheus
vim prometheus.yml
# my global config
global:
scrape_interval: 15s # Set the scrape interval to every 15 seconds. Default is every 1 minute.
evaluation_interval: 15s # Evaluate rules every 15 seconds. The default is every 1 minute.
# scrape_timeout is set to the global default (10s).
# Alertmanager configuration
alerting:
alertmanagers:
- static_configs:
- targets:
- localhost:9093
# Load rules once and periodically evaluate them according to the global 'evaluation_interval'.
rule_files:
- "rules/host_rules.yml"
# - "first_rules.yml"
# - "second_rules.yml"
# A scrape configuration containing exactly one endpoint to scrape:
# Here it's Prometheus itself.
scrape_configs:
# The job name is added as a label `job=<job_name>` to any timeseries scraped from this config.
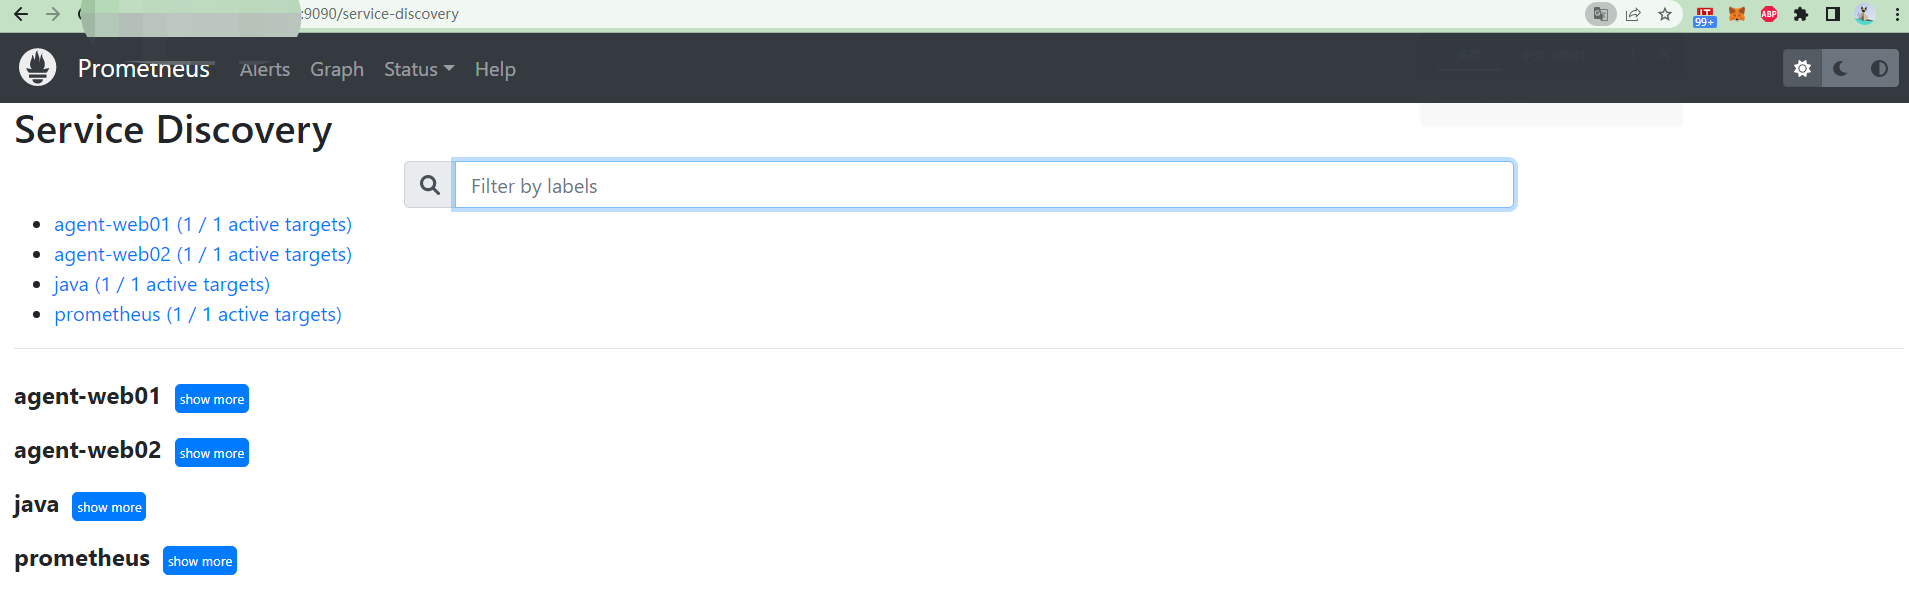
- job_name: "prometheus"
# metrics_path defaults to '/metrics'
# scheme defaults to 'http'.
static_configs:
- targets: ["localhost:9090"]
- job_name: 'agent-web01'
static_configs:
- targets: ['172.31.32.104:9100']
- job_name: 'agent-web02'
static_configs:
- targets: ['172.31.29.223:9100']
- job_name: 'java'
static_configs:
- targets: ['172.31.29.223:8100']
metrics_path: '/actuator/prometheus'
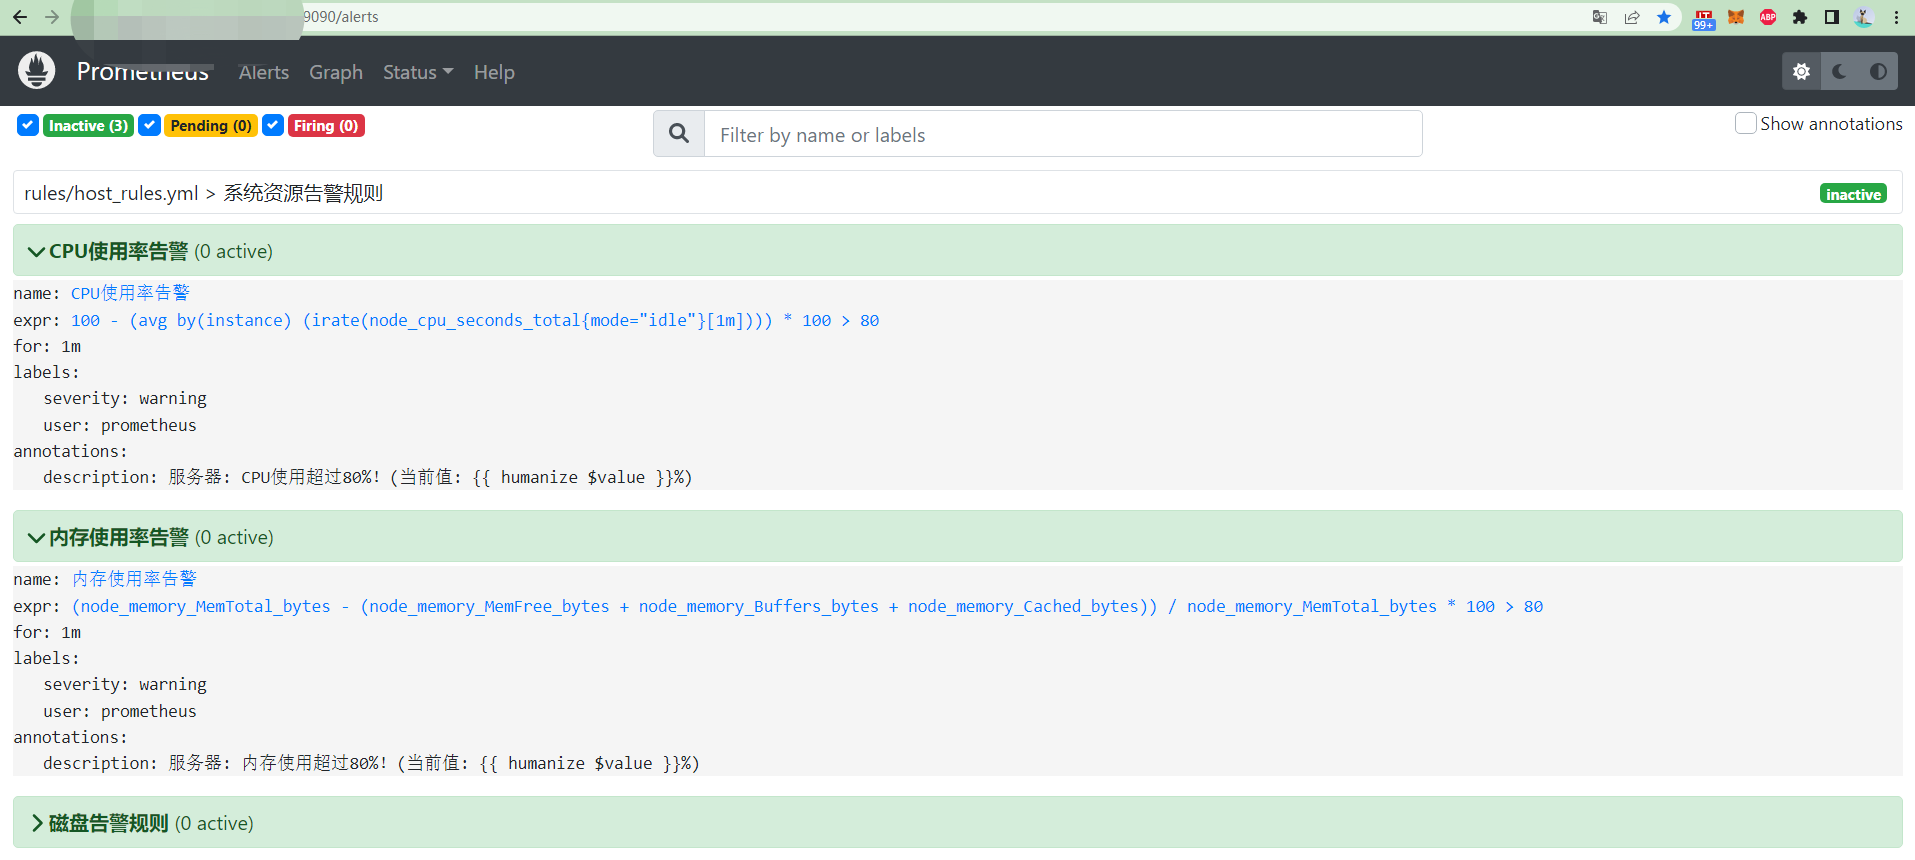
創建規則
mkdir -p /root/prometheus/rules
cat host_rules.yml
groups:
- name: 系統資源告警規則
  rules:
  - alert: CPU使用率告警
    expr: 100 - (avg by (instance)(irate(node_cpu_seconds_total{mode="idle"}[1m]) )) * 100 > 80
    for: 1m
    labels:
      user: prometheus
      severity: warning
    annotations:
      description: "伺服器: CPU使用超過80%!(當前值: {{ humanize $value }}%)"
  - alert: 記憶體使用率告警
    expr: (node_memory_MemTotal_bytes - (node_memory_MemFree_bytes+node_memory_Buffers_bytes+node_memory_Cached_bytes )) / node_memory_MemTotal_bytes * 100 > 80
    for: 1m
    labels:
      user: prometheus
      severity: warning
    annotations:
      description: "伺服器: 記憶體使用超過80%!(當前值: {{ humanize $value }}%)"
  - alert: 磁碟告警規則
    expr: 100 - (node_filesystem_free_bytes{mountpoint="/",fstype=~"ext4|xfs"} / node_filesystem_size_bytes{fstype=~"ext4|xfs"} * 100) > 70
    for: 1m
    labels:
      user: prometheus
      severity: warning
    annotations:
      description: "伺服器: 磁碟使用超過70%!(當前值: {{ humanize $value }}%)"
啟動
nohup ./prometheus &
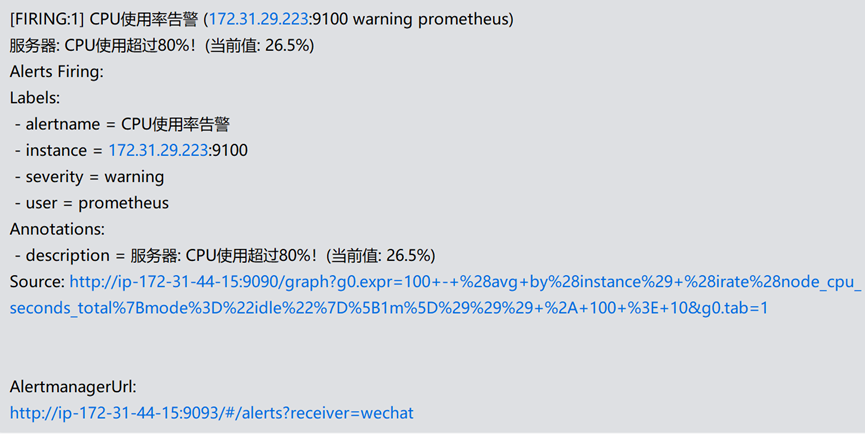
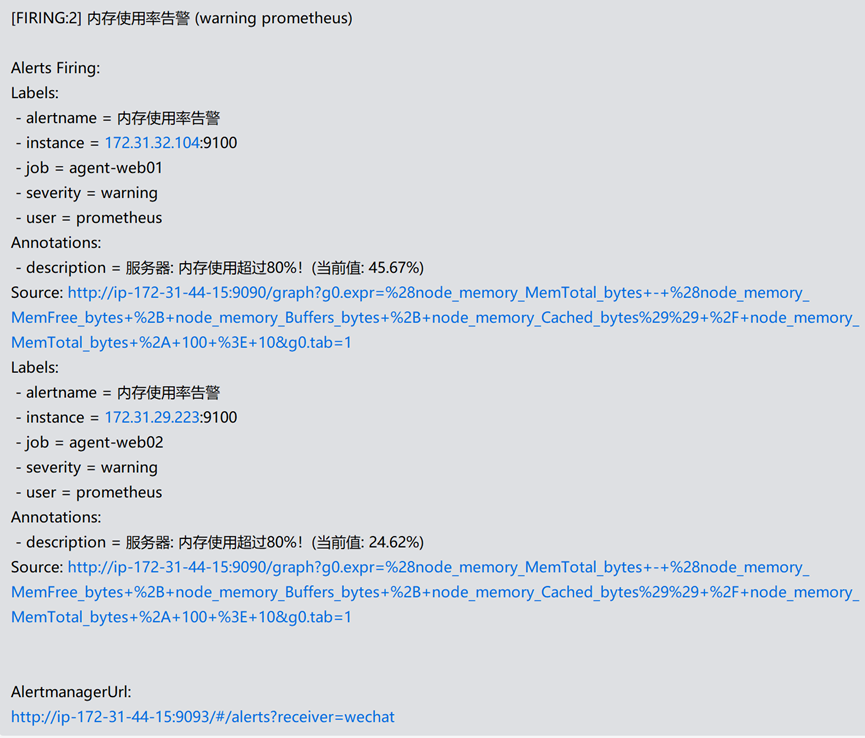
效果圖
安裝alertmanager
tar -zxvf alertmanager-0.24.0.linux-amd64.tar.gz
mv alertmanager-0.24.0.linux-amd64 alertmanager
vim alertmanager.yml
具體可以去企業微信後臺查找相關參數
global:
  resolve_timeout: 2m
  wechat_api_url: 'https://qyapi.weixin.qq.com/cgi-bin/'
  wechat_api_secret: '<你的企業微信secret>'
  wechat_api_corp_id: '<你的企業微信id>'

route:
  group_by: ['alertname']
  group_wait: 10s
  group_interval: 10s
  repeat_interval: 1h
  receiver: 'wechat'
receivers:
- name: 'wechat'
  wechat_configs:
  - send_resolved: true
    to_party: '1'
    agent_id: '<你的企業微信應用id>'
templates:
  - '/alertmanager/*.tmpl'
yaml語法檢查
./amtool check-config alertmanager.yml
企業微信報警模板
cat wechat.tmpl
 {{ define "wechat.default.message" }}
{{- if gt (len .Alerts.Firing) 0 -}}
{{- range $index, $alert := .Alerts -}}
======== 異常告警 ========
告警名稱:{{ $alert.Labels.alertname }}
告警級別:{{ $alert.Labels.severity }}
告警機器:{{ $alert.Labels.instance }} {{ $alert.Labels.device }}
告警詳情:{{ $alert.Annotations.summary }}
告警時間:{{ $alert.StartsAt.Format "2006-01-02 15:04:05" }}
========== END ==========
{{- end }}
{{- end }}
{{- if gt (len .Alerts.Resolved) 0 -}}
{{- range $index, $alert := .Alerts -}}
======== 告警恢復 ========
告警名稱:{{ $alert.Labels.alertname }}
告警級別:{{ $alert.Labels.severity }}
告警機器:{{ $alert.Labels.instance }}
告警詳情:{{ $alert.Annotations.summary }}
告警時間:{{ $alert.StartsAt.Format "2006-01-02 15:04:05" }}
恢復時間:{{ $alert.EndsAt.Format "2006-01-02 15:04:05" }}
========== END ==========
{{- end }}
{{- end }}
{{- end }}
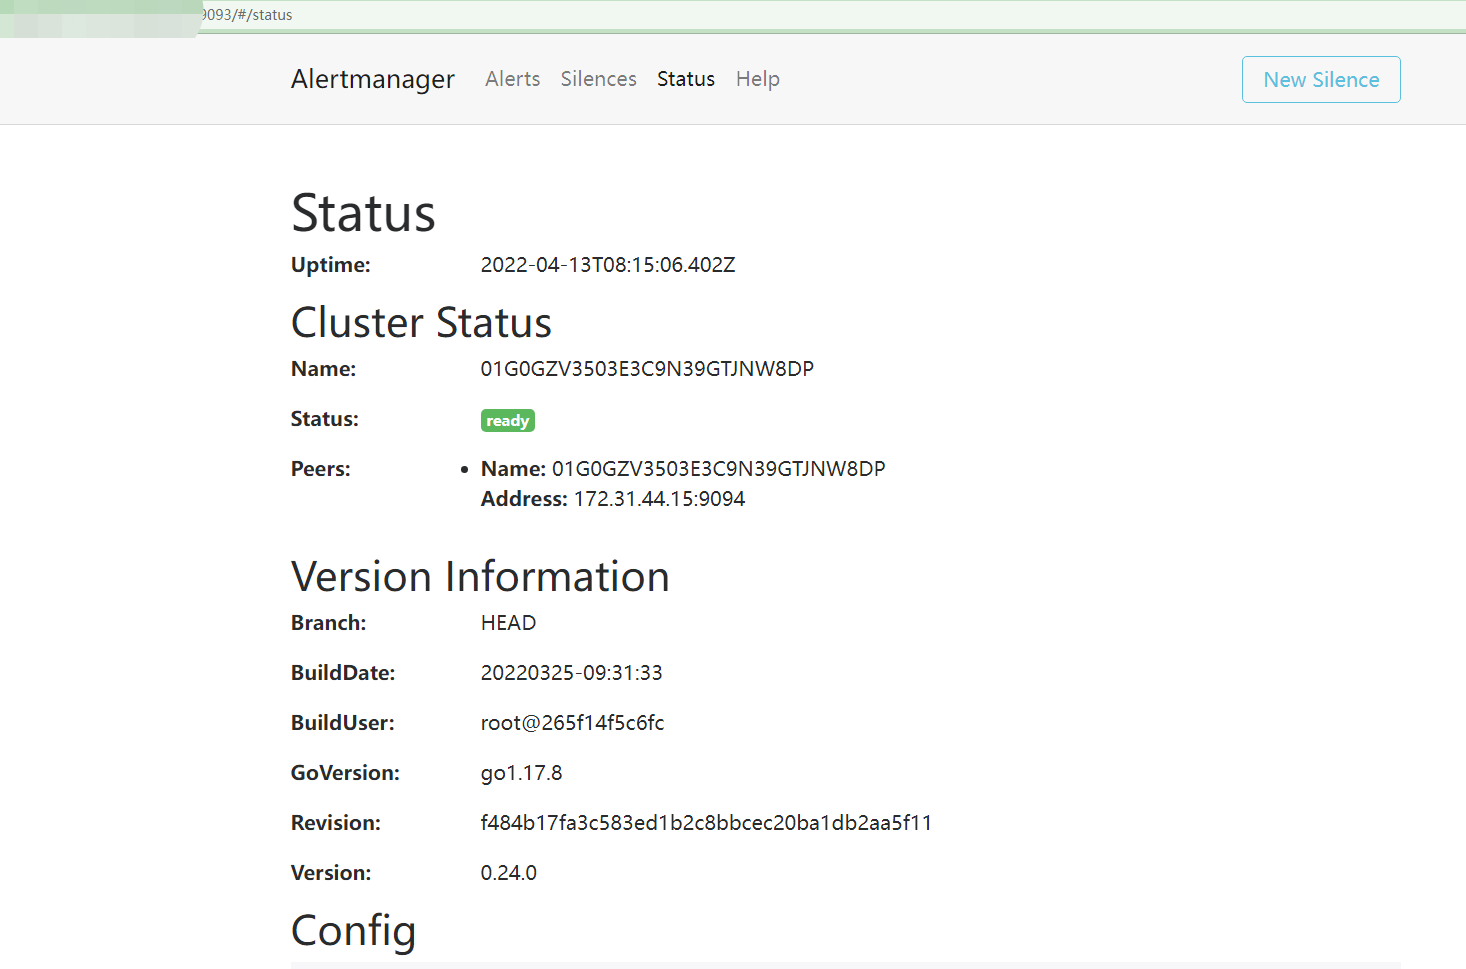
啟動
nohup ./alertmanager &
安裝Grafana
wget https://dl.grafana.com/oss/release/grafana-8.4.6.linux-amd64.tar.gz
tar -zxvf grafana-8.4.6.linux-amd64.tar.gz
mv grafana-8.4.6.linux-amd64 grafana
配置未更改,走的預設,也可以根據具體情況做相應的配置改動
啟動
nohup ./grafana &
配置數據源為Prometheus
因為在本地,所以首選localhost
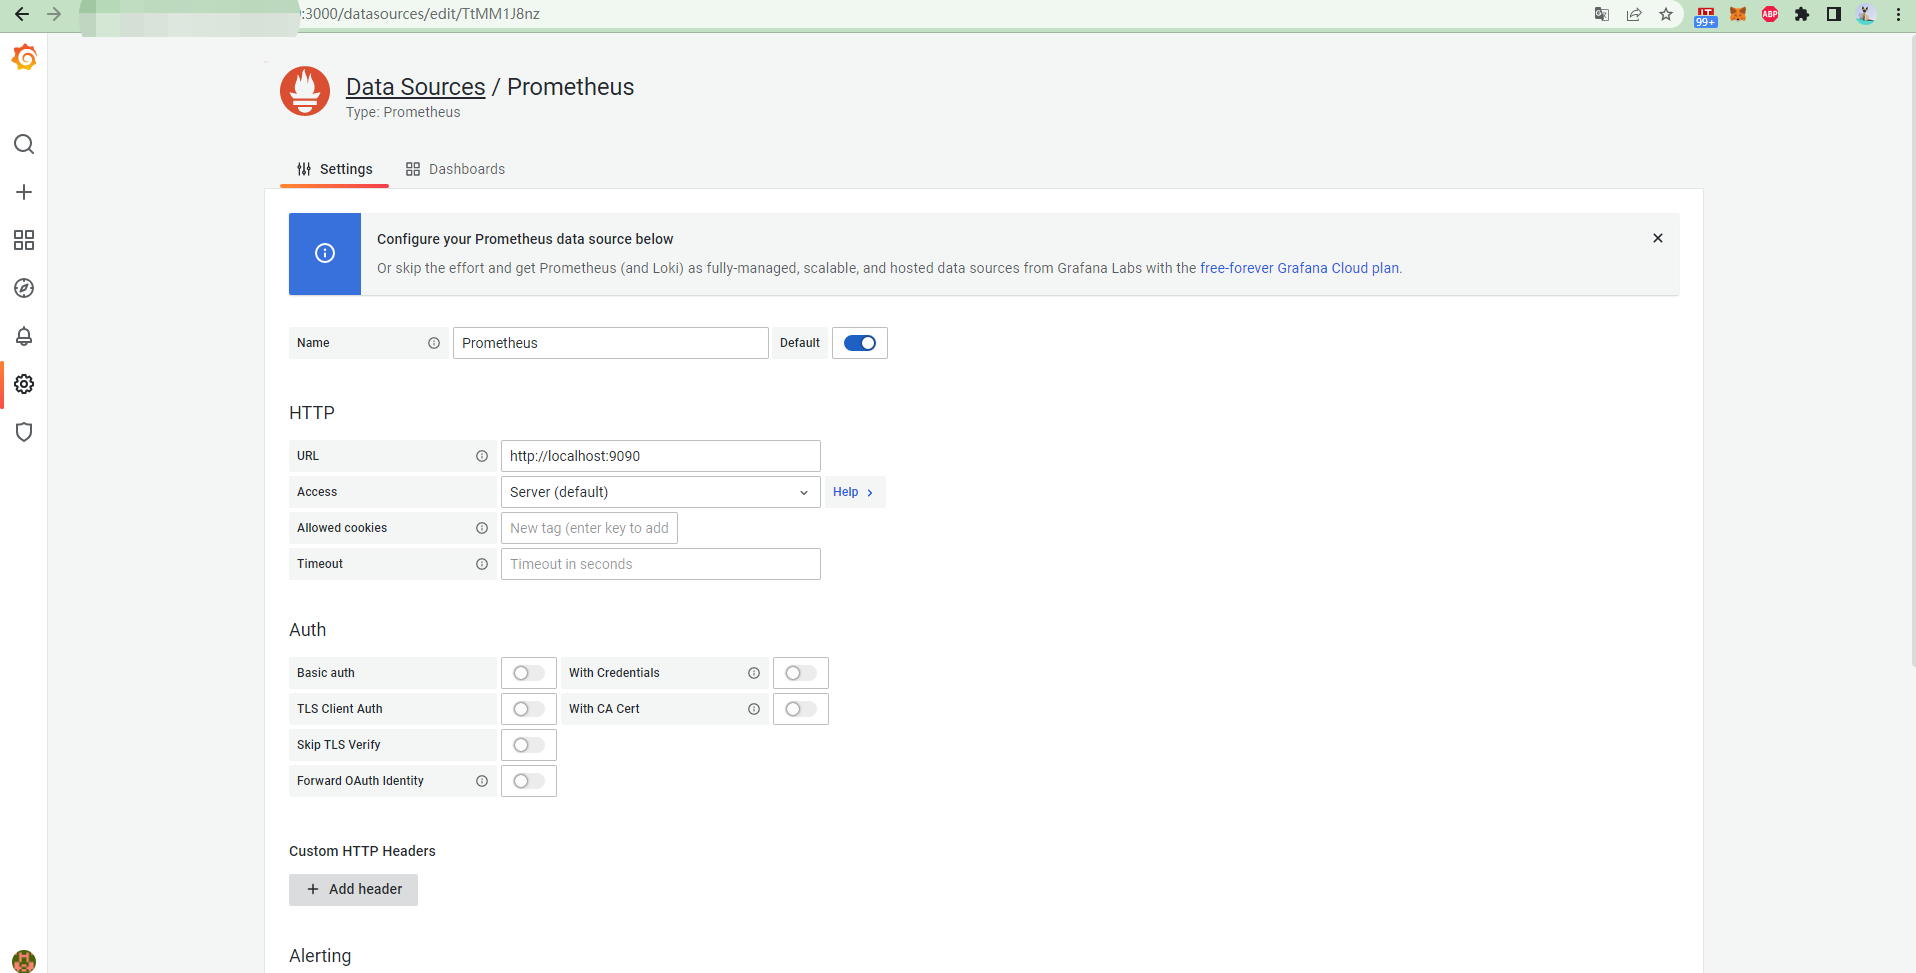
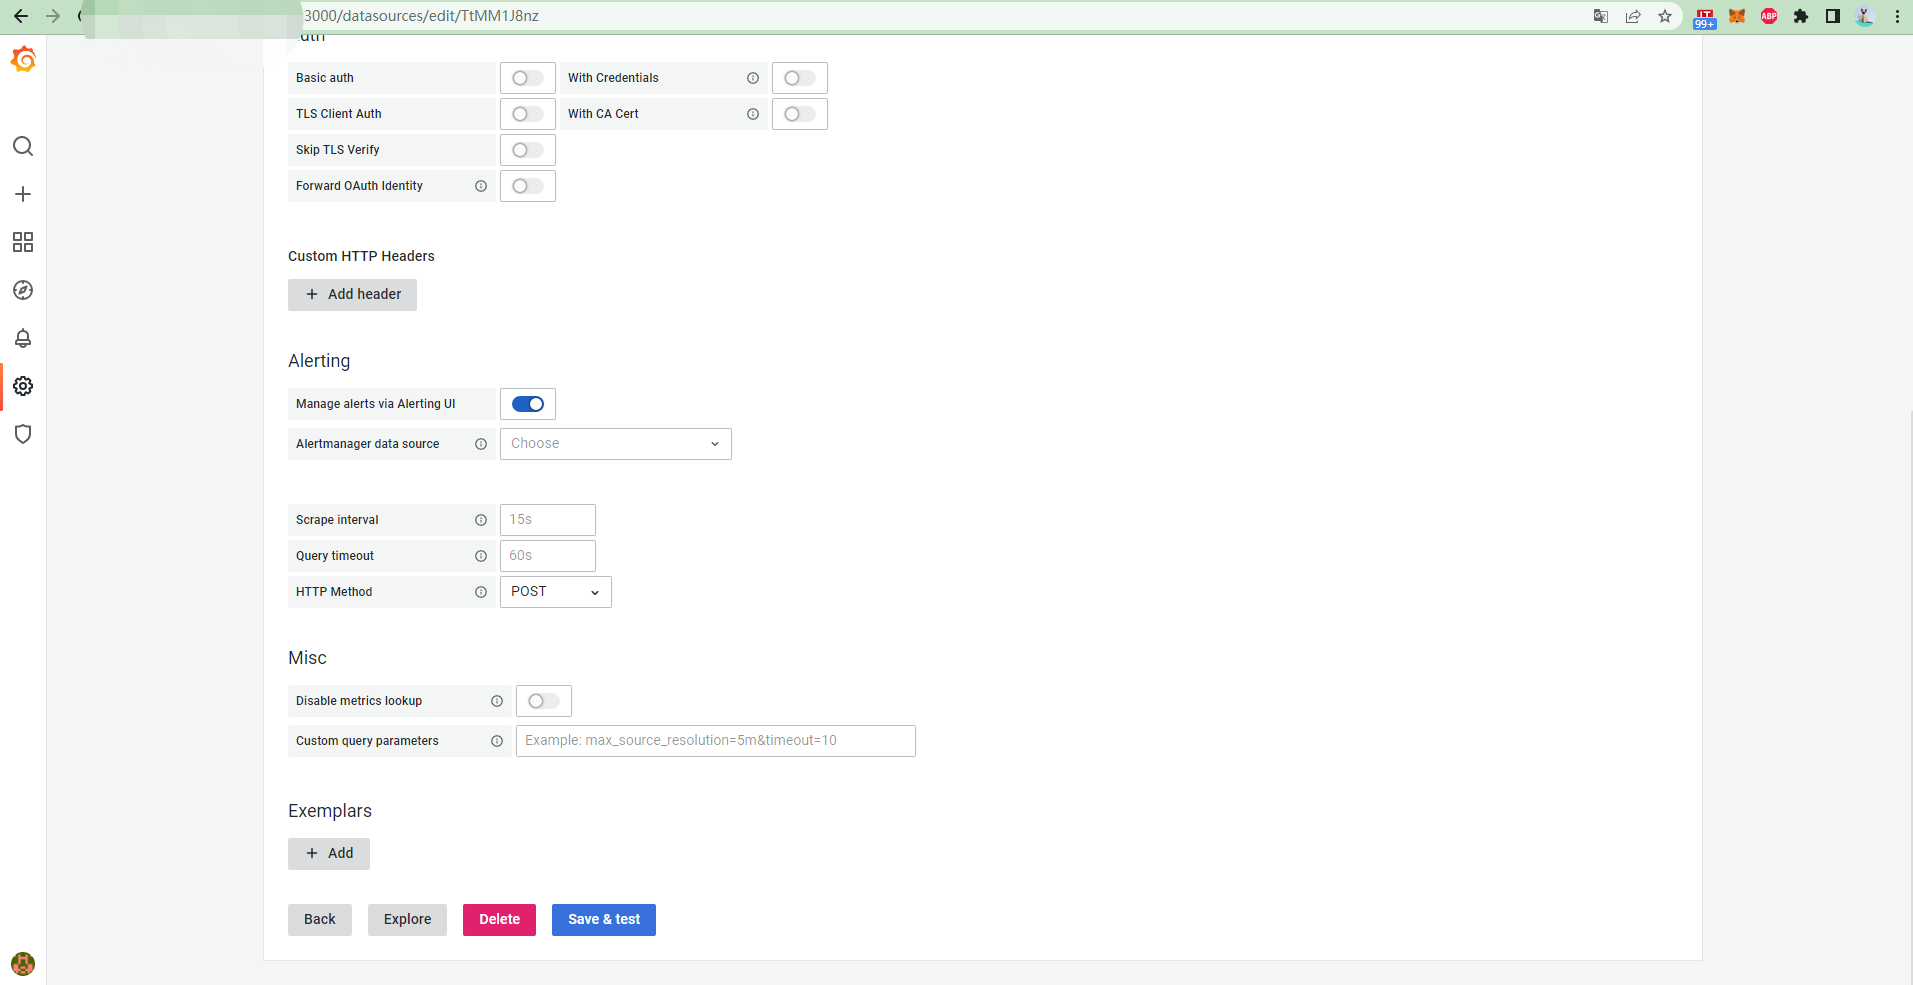
保存並測試
導入配置
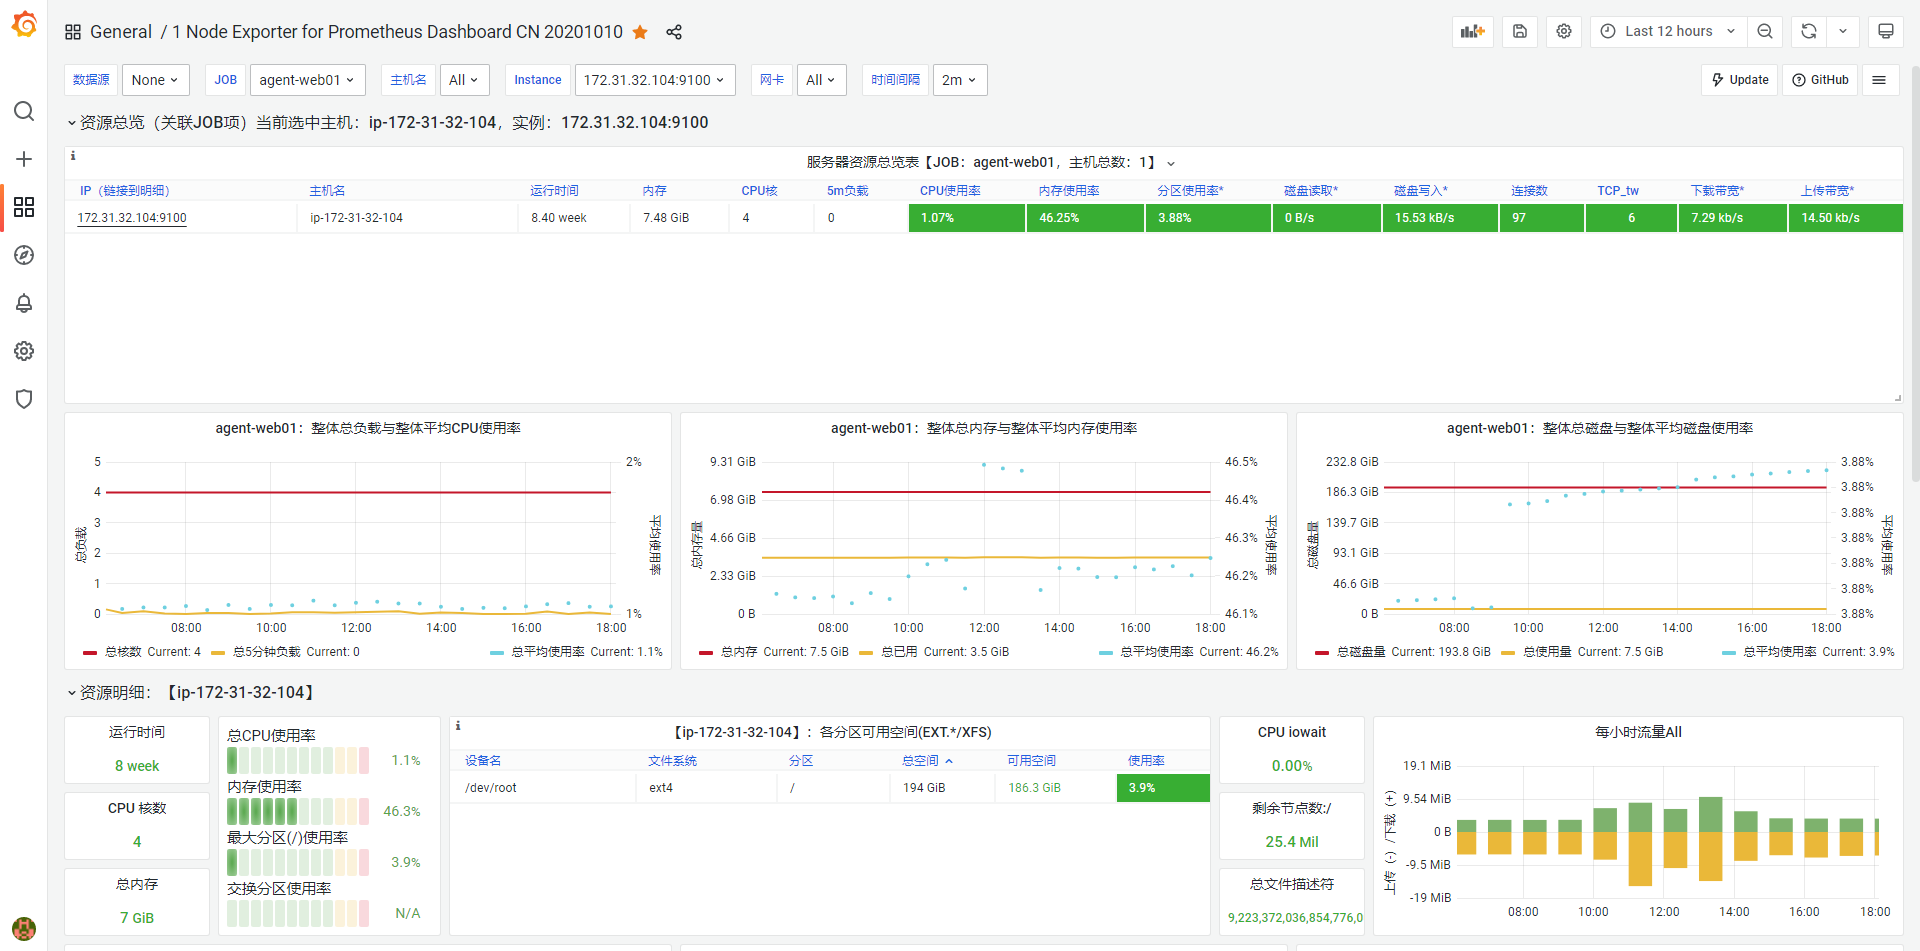
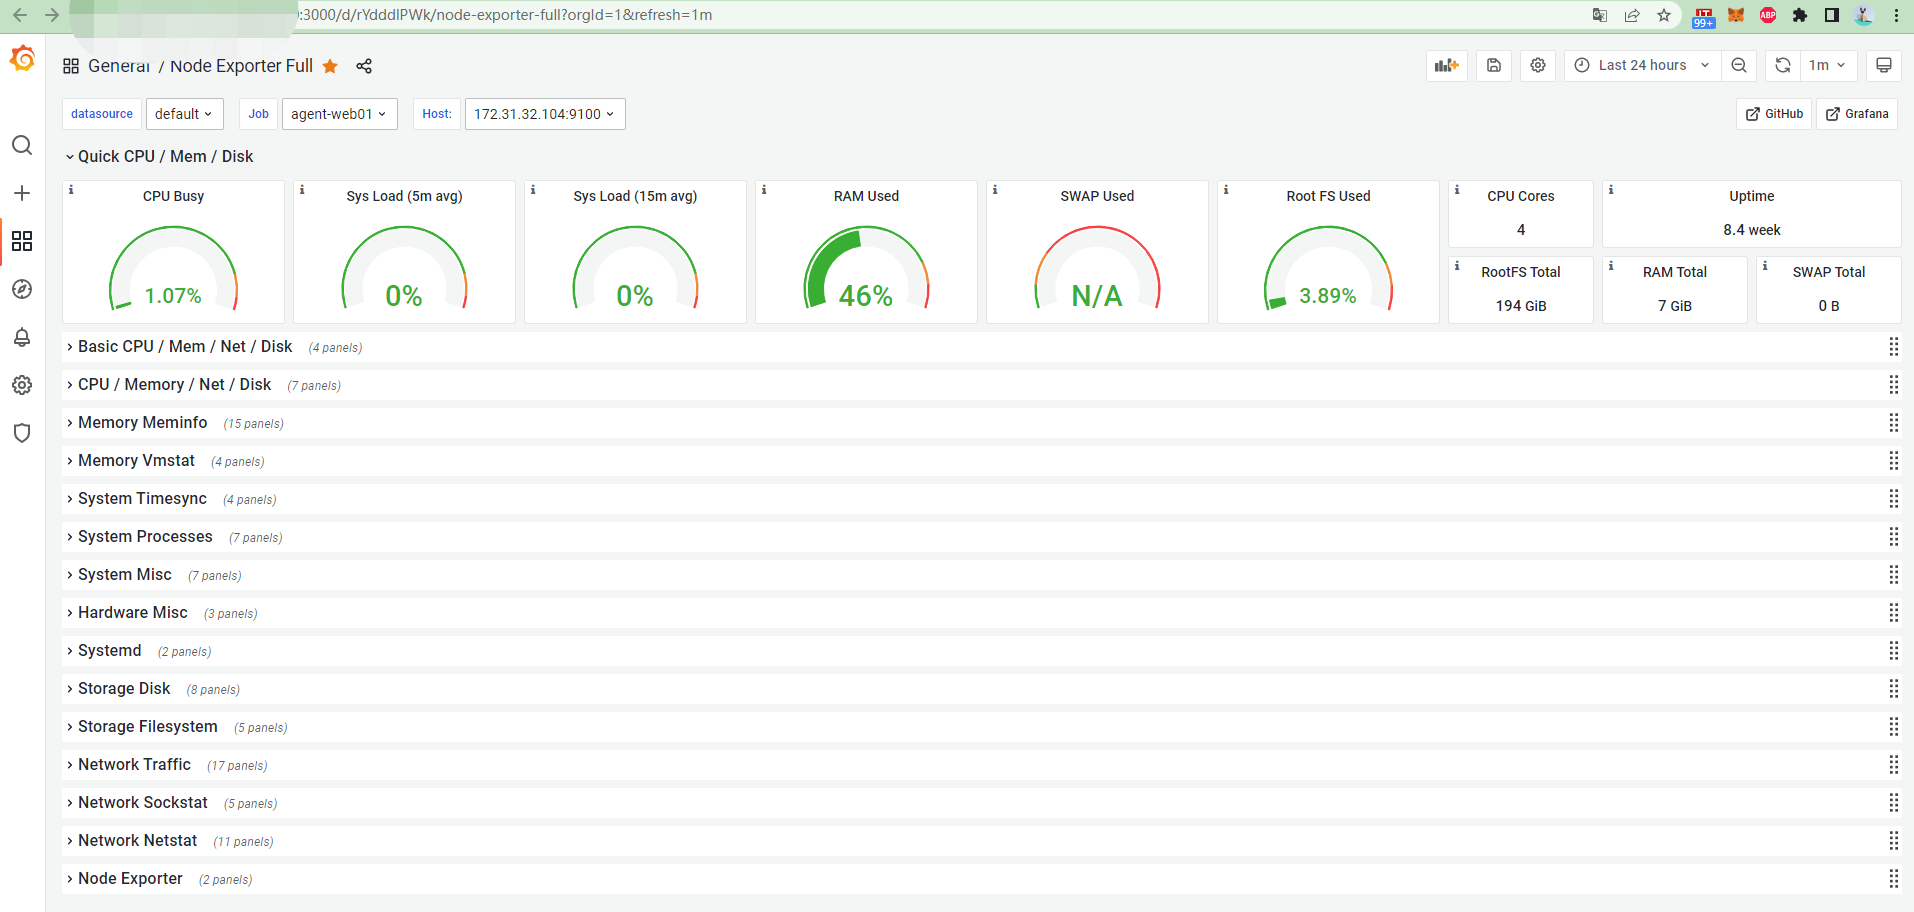
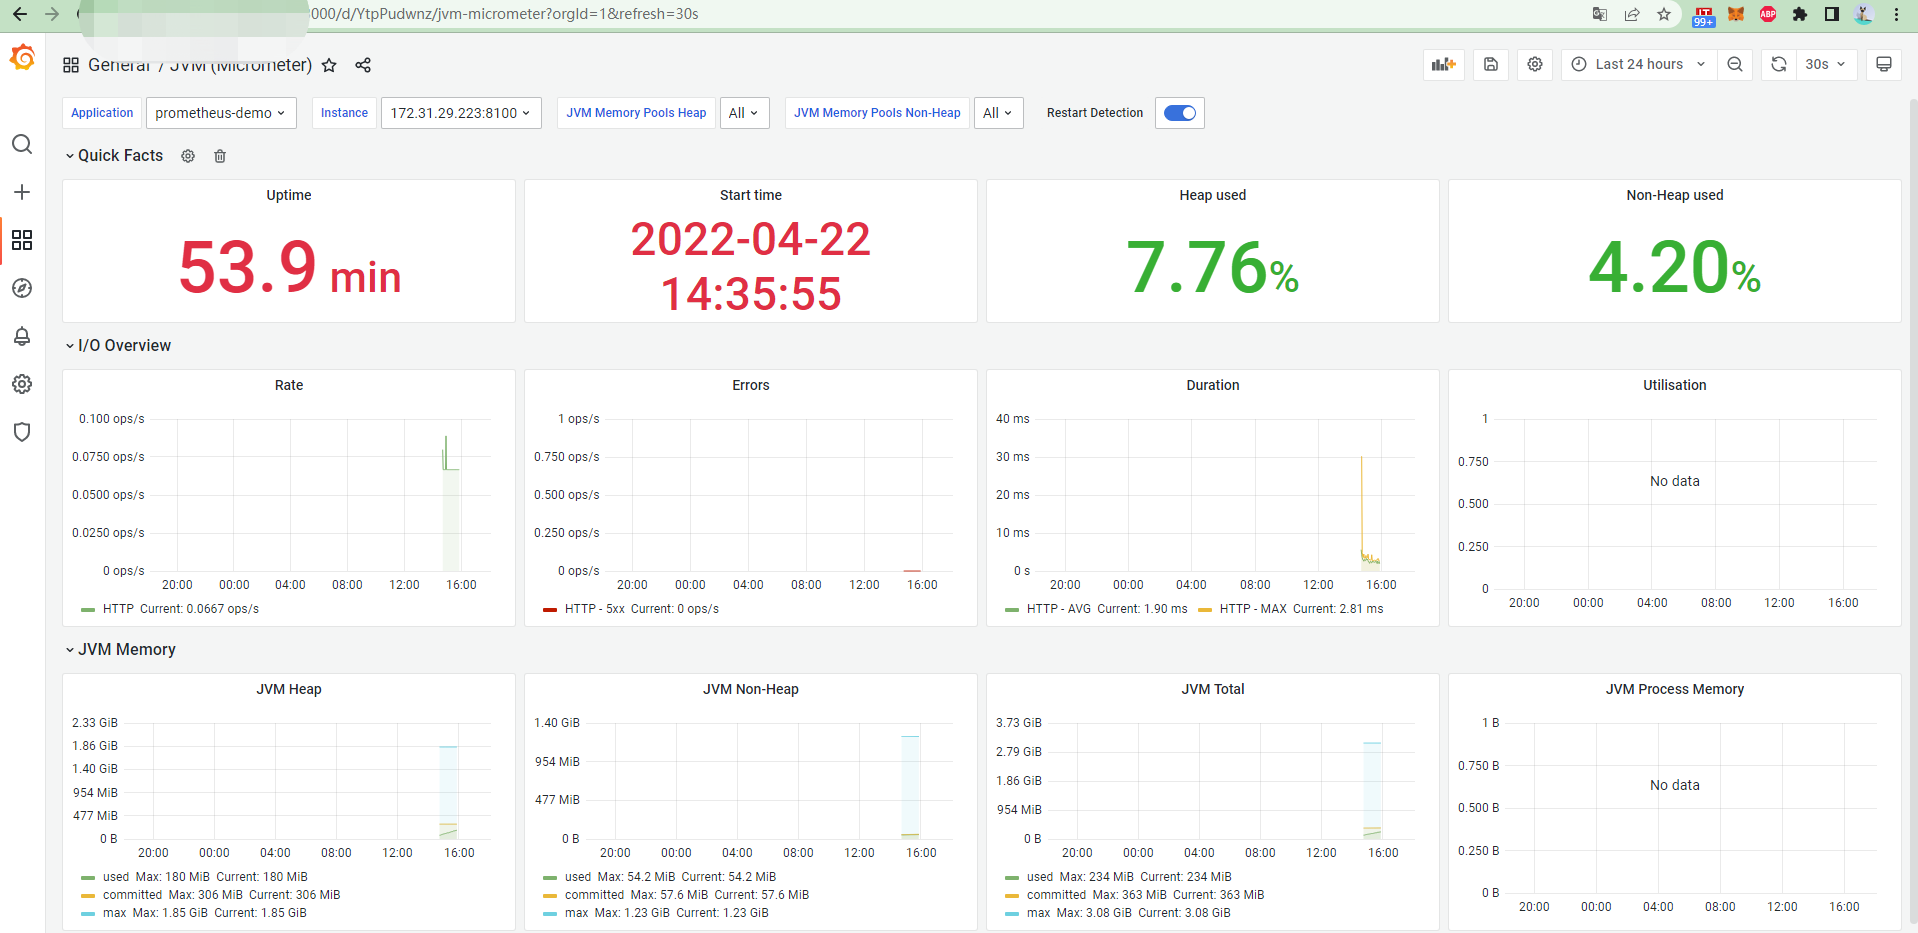
grafana dashboard地址
https://grafana.com/grafana/dashboards
11074 ------1 Node Exporter for Prometheus Dashboard EN 20201010
1860 -------Node Exporter Full
4701 -------JVM (Micrometer)
參考鏈接
https://blog.51cto.com/u_15060547/3817600
https://www.cnblogs.com/Devinhao/articles/16180018.html
本文由博客一文多發平臺 OpenWrite 發佈!
本文來自博客園,作者:Devinhao,轉載請註明原文鏈接:https://www.cnblogs.com/Devinhao/p/16184823.html