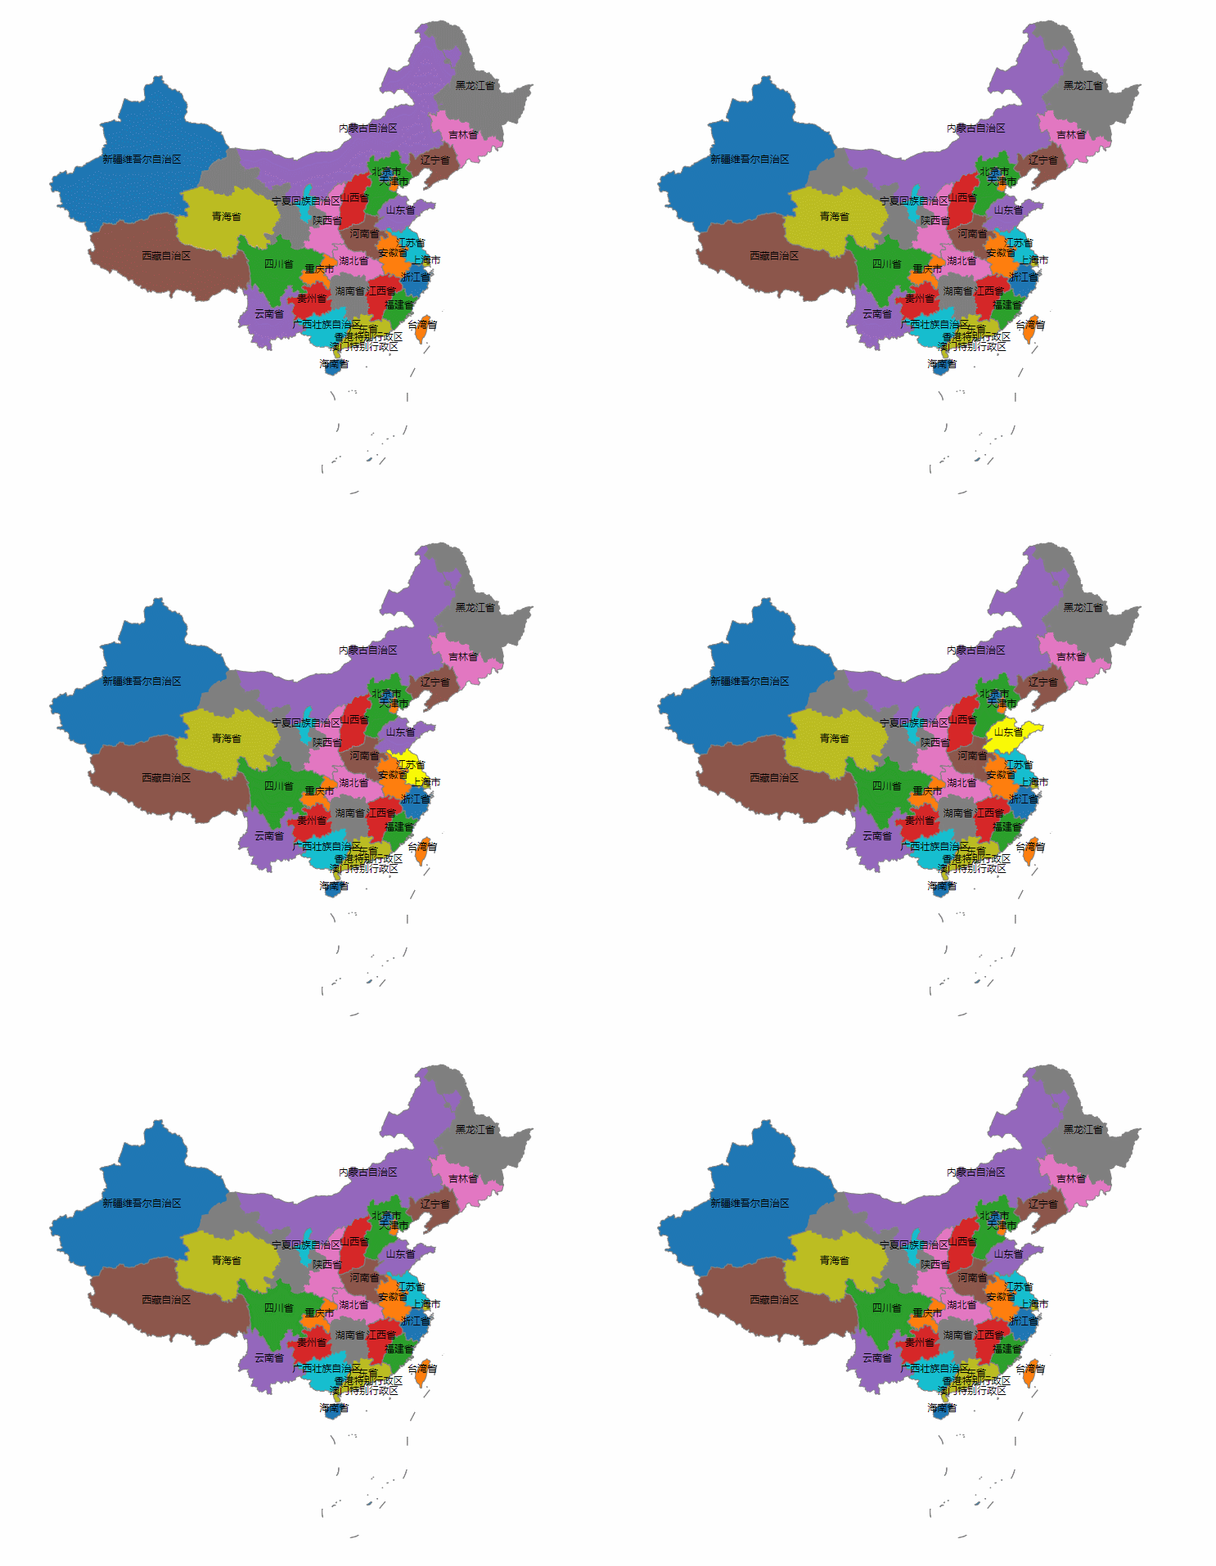
首先我們需要的是 中國地圖的json數據:請戳這裡 接下來咱們直接上代碼: 代碼: <!DOCTYPE html> <html lang="en"> <head> <meta charset="UTF-8"> <title>中國地圖</title> <script src="./d3.min.js" ...
首先我們需要的是 中國地圖的json數據:請戳這裡
接下來咱們直接上代碼:
代碼:
<!DOCTYPE html>
<html lang="en">
<head>
    <meta charset="UTF-8">
    <title>中國地圖</title>
    <script src="./d3.min.js"></script>
</head>
<body>

<svg width="900" height="700"></svg>


</body>

<script>

    //獲取svg
    var svg = d3.select('svg');
    var width = svg.attr('width');
    var height = svg.attr('height');

    //創建區域分組
    var g = svg.append('g').attr('transform','translate(0,0)');

    //創建一個地圖投影
    var mercator = d3.geoMercator()
        .center([107,31])//設置投影的中心點 經緯度
        .scale(550)//設置縮放因數
        .translate([width/2,height/2]);//設置平移偏移量

    //創建一個地理路徑生成器
    var geoPath = d3.geoPath()
        .projection(mercator)//設置地理路徑生成器的投影方式

    //獲取中國地圖的json文件
    //利用node.js 在本地起一個http-server
    d3.json('map.json').then(function (data) {//D3 v5版本d3.json()現在將返回一個你可以在.then()方法中處理的Promise
        console.log(data);//features

        //新建一個顏色比例尺
        var scaleColor = d3.scaleOrdinal()
            .domain(d3.range(data.features.length))
            .range(d3.schemeCategory10);


        //繪製區域
        g.append('g')
            .selectAll('path')
            .data(data.features)
            .enter()
            .append('path')
            .attr('stroke','gray')
            .attr('strok-widht',1)
            .attr('d',function (d,i) {
                return geoPath(d);
            })
            .attr('fill',function (d,i) {
                return scaleColor(i);
            })
            .on('mouseover',function (d,i) {
                d3.select(this).attr('fill','yellow');
            })
            .on('mouseout',function (d,i) {
                d3.select(this).attr('fill',scaleColor(i));
            });

        //繪製文字
        g.append('g')
            .selectAll('text')
            .data(data.features)
            .enter()
            .append('text')
            .attr('font-size',12)
            .attr('text-anchor', 'middle')
            .attr('x',function (d,i) {
                var position = mercator(d.properties.centroid || [0,0]);
                return position[0];
            })
            .attr('y',function (d,i) {
                var position = mercator(d.properties.centroid || [0,0]);
                return position[1];
            })
            .attr('dy',function (d,i) {
                //這裡為什麼這麼寫呢,因為澳門和香港重合了,擠到一起了。
                if (d.properties.name === '澳門特別行政區') {
                    return 10;
                }
            })
            .text(function (d,i) {
               return d.properties.name;
            });

    });

</script>
</html>
效果:


