現在的商場管理者在管理商場的同時面臨著一些無法避免的問題比如:人員監管不到位、效率低下、商場同質化嚴重,人流量少等。發現了這些問題作為開發人員的我們怎能視而不見,我們的責任就是發現問題解決問題,提供更好更智能的服務。因此就此問題我們想出了相應的解決辦法,使用JS+Three.js+Echart開發了... ...
現在的商場管理者在管理商場的同時面臨著一些無法避免的問題比如:人員監管不到位、效率低下、商場同質化嚴重,人流量少等。發現了這些問題作為開發人員的我們怎能視而不見,我們的責任就是發現問題解決問題,提供更好更智能的服務。因此就此問題我們想出了相應的解決辦法,使用JS+Three.js+Echart開發了一個功能界面,為商場管理者提供更加高效的管理方法。
通過商場管理系統的相應界面,商場管理者可實時獲取商場的人流數據、人流密度的熱力分佈、可實時查看商場各處的視頻監控信息、安保人員的實時位置信息及運動軌跡。針對突髮狀況可以即時調度、快速處理。還可以依據大數據分析周邊業態情況,為制定運營策略提供數據支持等。
就以上的市場實際情況需求,開始了我的功能開發之旅。
我使用ESMap的地圖編輯器編輯好商場地圖後,開始佈局規劃解決問題
開發流程如下:
首先,實現一個商場客流量信息的餅狀統計表,還有各個時間點的流量趨勢和人群密度的線性圖表。再實現一個控制面板,可以通過控制面板根據地圖的熱力圖查看商場各個位置客流量以及各個位置的實時視頻等,情況一目瞭然;最後做一個可以搜索店鋪客流量及營業額情況的搜索框。
1.方便開發,先使用模擬數據創建圖表,投入使用後自行接入後臺數據即可。
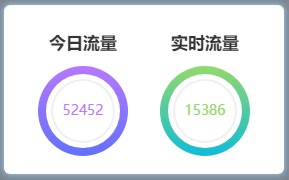
(1)使用Echart創建統計客流量的餅狀圖:
function circleSet() {
        myChart1 = echarts.init(document.getElementById('ec1'));
        myChart2 = echarts.init(document.getElementById('ec2'));
        var color= ['#b679fe', '#6271fd','#94d96c', '#0fbdd9','#f0f0f0'];
        var dataStyle = {
            normal: {
                label: {
                    show: false
                },
                labelLine: {
                    show: false
                },
                shadowBlur: 40,
                borderWidth: 10,
                shadowColor: 'rgba(0, 0, 0, 0)' //邊框陰影
            }
        };
        //第一個餅狀圖
        var optionCircleA = {
            backgroundColor: '#fff',
            title: {
                text: '52452',
                x: 'center',
                y: 'center',
                textStyle: {
                    fontWeight: 'normal',
                    fontSize: 14,
                    color: "#b679fe",
                }
            },
            series: [{
                    name: 'Line 1',
                    type: 'pie',
                    clockWise: false,
                    radius: [37, 45],
                    center:['50%','50%'],
                    itemStyle: dataStyle,
                    hoverAnimation: false,
                    startAngle: 90,
                    label:{
                        borderRadius:'10',
                    },
                    data: [{
                            value: 54.6,
                            name: '外',
                            itemStyle: {
                                normal: {
                                    color: new echarts.graphic.LinearGradient(0, 0, 0, 1, [{
                                        offset: 0,
                                        color:color[0]
                                    }, {
                                        offset: 1,
                                        color: color[1]
                                    }])
                                }
                            }
                        },
                        {
                            value: 0,
                            name: '',
                            tooltip: {
                                show: false
                            },
                        },
                    ]
                },
                {
                    name: 'Line 2',
                    type: 'pie',
                    clockWise: false,
                    radius: [30, 32],
                    center:['50%','50%'],
                    itemStyle: dataStyle,
                    hoverAnimation: false,
                    startAngle: 90,
                    data: [{
                            value: 56.7,
                            name: '內',
                            itemStyle: {
                                normal: {
                                    color: new echarts.graphic.LinearGradient(0, 0, 0, 1, [{
                                        offset: 0,
                                        color: color[4]
                                    }, {
                                        offset: 1,
                                        color: color[4]
                                    }])
                                }
                            }
                        },
                        {
                            value: 0,
                            name: '',
                            tooltip: {
                                show: false
                            },
                        },
                    ]
                },
            ]
        };
    //第二個餅狀圖
        var optionCircleB = {
            backgroundColor: '#fff',
            title: {
                text: '15386',
                x: 'center',
                y: 'center',
                textStyle: {
                    fontWeight: 'normal',
                    fontSize: 14,
                    color: "#94d96c",
                }
            },
            series: [{
                    name: 'Line 1',
                    type: 'pie',
                    clockWise: false,
                    radius: [37, 45],
                    center:['50%','50%'],
                    itemStyle: dataStyle,
                    hoverAnimation: false,
                    startAngle: 90,
                    label:{
                        borderRadius:'10',
                    },
                    data: [{
                            value: 54.6,
                            name: '外',
                            itemStyle: {
                                normal: {
                                    color: new echarts.graphic.LinearGradient(0, 0, 0, 1, [{
                                        offset: 0,
                                        color:color[2]
                                    }, {
                                        offset: 1,
                                        color: color[3]
                                    }])
                                }
                            }
                        },
                        {
                            value: 0,
                            name: '',
                            tooltip: {
                                show: false
                            },
                        },
                    ]
                },
                {
                    name: 'Line 2',
                    type: 'pie',
                    clockWise: false,
                    radius: [30, 32],
                    center:['50%','50%'],
                    itemStyle: dataStyle,
                    hoverAnimation: false,
                    startAngle: 90,
                    data: [{
                            value: 56.7,
                            name: '內',
                            itemStyle: {
                                normal: {
                                    color: new echarts.graphic.LinearGradient(0, 0, 0, 1, [{
                                        offset: 0,
                                        color: color[4]
                                    }, {
                                        offset: 1,
                                        color: color[4]
                                    }])
                                }
                            }
                        },
                        {
                            value: 0,
                            name: '',
                            tooltip: {
                                show: false
                            },
                        },
                    ]
                },
            ]
        };
        myChart1.setOption(optionCircleA);
        myChart2.setOption(optionCircleB);
    }
效果如下圖:

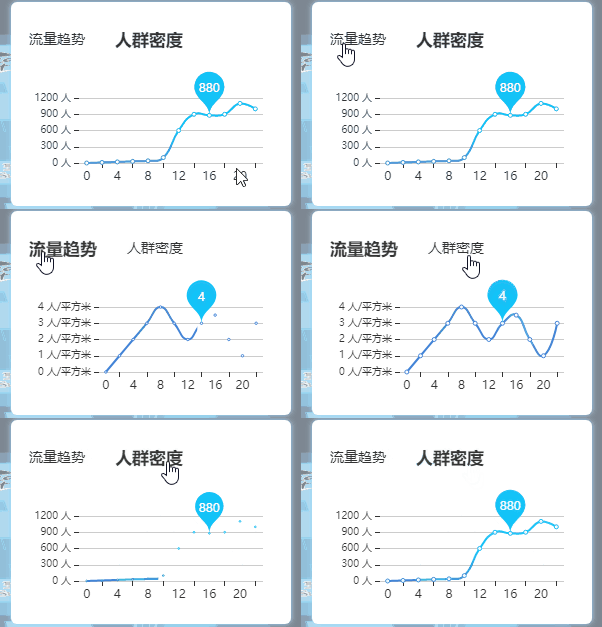
(2)使用echart創建人群密度線性圖表,封裝在函數lineSetA()內:
    //人群密度線性圖表
    function lineSetA() {
        myChart3 = echarts.init(document.getElementById('ec3'));
        var colors = ['#12c3f8', '#4384d7'];
        optionLineA = {
            color: colors,
            visualMap: [{
                show: false,
                type: 'continuous',
                seriesIndex: 0,
                min: 0,
                max: 600,
                borderWidth: 3,
                color: colors,
            }],
            xAxis: {
                type: 'category',
                data: ['0', '2', '4', '6', '8', '10', '12', '14', '16', '18', '20', '22'],
                show: true,
                position: {
                  bottom: 10,
                  show: false,
                },
                onZero: false,
                axisLine: {
                    lineStyle: {
                        width: 0,
                    }
                }
            },
            yAxis: {
                type: 'value',
                axisLabel: {
                    formatter: '{value} 人',
                    fontSize: 10,
                },
                axisLine: {
                    lineStyle: {
                        width: 0,
                    }
                },
                minInterval: 300,
            },
            grid: [{
                top: '40',
                bottom: '25',
                left: '50',
                right: '10'
            }],
            series: [{
                data: [ 0, 10, 20, 30, 40, 100, 600, 900, 880, 900, 1100, 1000],
                type: 'line',
                smooth: true,
                markPoint: {
                    data: [
                        {
                            name: '880',
                            coord: ['16','880'],
                            value: '880',
                    ],
                    label: {
                        show: true,
                    },
                }
            }]
        };
        myChart3.setOption(optionLineA);
    }
創建流量趨勢線性圖表,封裝在函數lineSetB()內:
//流量趨勢線性圖表
    function lineSetB() {
        myChart4 = echarts.init(document.getElementById('ec3'));
        var colors = ['#12c3f8', '#4384d7'];
        var optionLineB = {
            color: colors,
            visualMap: [{
                show: false,
                type: 'continuous',
                seriesIndex: 0,
                min: 0,
                max: 600,
                borderWidth: 3,
                color: colors,
            }],
            xAxis: {
                type: 'category',
                data: ['0', '2', '4', '6', '8', '10', '12', '14', '16', '18', '20', '22'],
                show: true,
                position: {
                  bottom: 10,
                  show: false,
                },
                onZero: false,
                axisLine: {
                    lineStyle: {
                        width: 0,
                    }
                }
            },
            yAxis: {
                type: 'value',
                axisLabel: {
                    formatter: '{value} 人/平方米',
                    fontSize: 10,
                },
                axisLine: {
                    lineStyle: {
                        width: 0,
                    }
                },
                minInterval: 0.5,
            },
            grid: [{
                top: '40',
                bottom: '25',
                left: '70',
                right: '10'
            }],
            series: [{
                data: [ 0, 1, 2, 3, 4, 3, 2, 3, 3.5, 2, 1, 3],
                type: 'line',
                smooth: true,
                markPoint: {
                    data: [
                        {
                            name: '4',
                            coord: ['14','3'],
                            value: '4',
                        }
                    ],
                    label: {
                        show: true,
                    },
                }
            }]
        };
        myChart4.setOption(optionLineB);
    }
切換線性圖表數據顯示實現:
    //切換線性圖表數據顯示
    $(".list-b .title-box .t-a").click(function() {//點擊流量趨勢
        $(".list-b .title-box .t-b").removeClass('active');//移除當前樣式
        $(this).addClass('active');//給點擊添加新樣式
        resizeLineA();
    })
    $(".list-b .title-box .t-b").click(function() {//點擊人群密度
        $(".list-b .title-box .t-a").removeClass('active');
        $(this).addClass('active');
        resizeLineA(1);
    })
更換裝圖表的盒子(div)和線性圖表信息:
    function resizeLineA(n) {
        $(".line-cen").remove();//先移除原有的盒子
        var aa = document.createElement('div');//在創建一個新盒子裝圖表
        aa.id = 'ec3'
        aa.className = 'line-cen'
        $(".line-box").append(aa)
        if (n == 1) {
            lineSetA();//顯示人群密度圖表
        } else {
            lineSetB();//顯示流量趨勢圖表
        }
    }
效果如下圖:

除此之外,還可以根據實際情況再添加相應的圖表。
2.check控制面板
開發一個控制面板,對管理者來說可以更好的全局掌握控制商場情況我在控制面板上加了實時視頻,全景漫游和客流分佈,下麵就這三個功能的實現過程做下介紹。
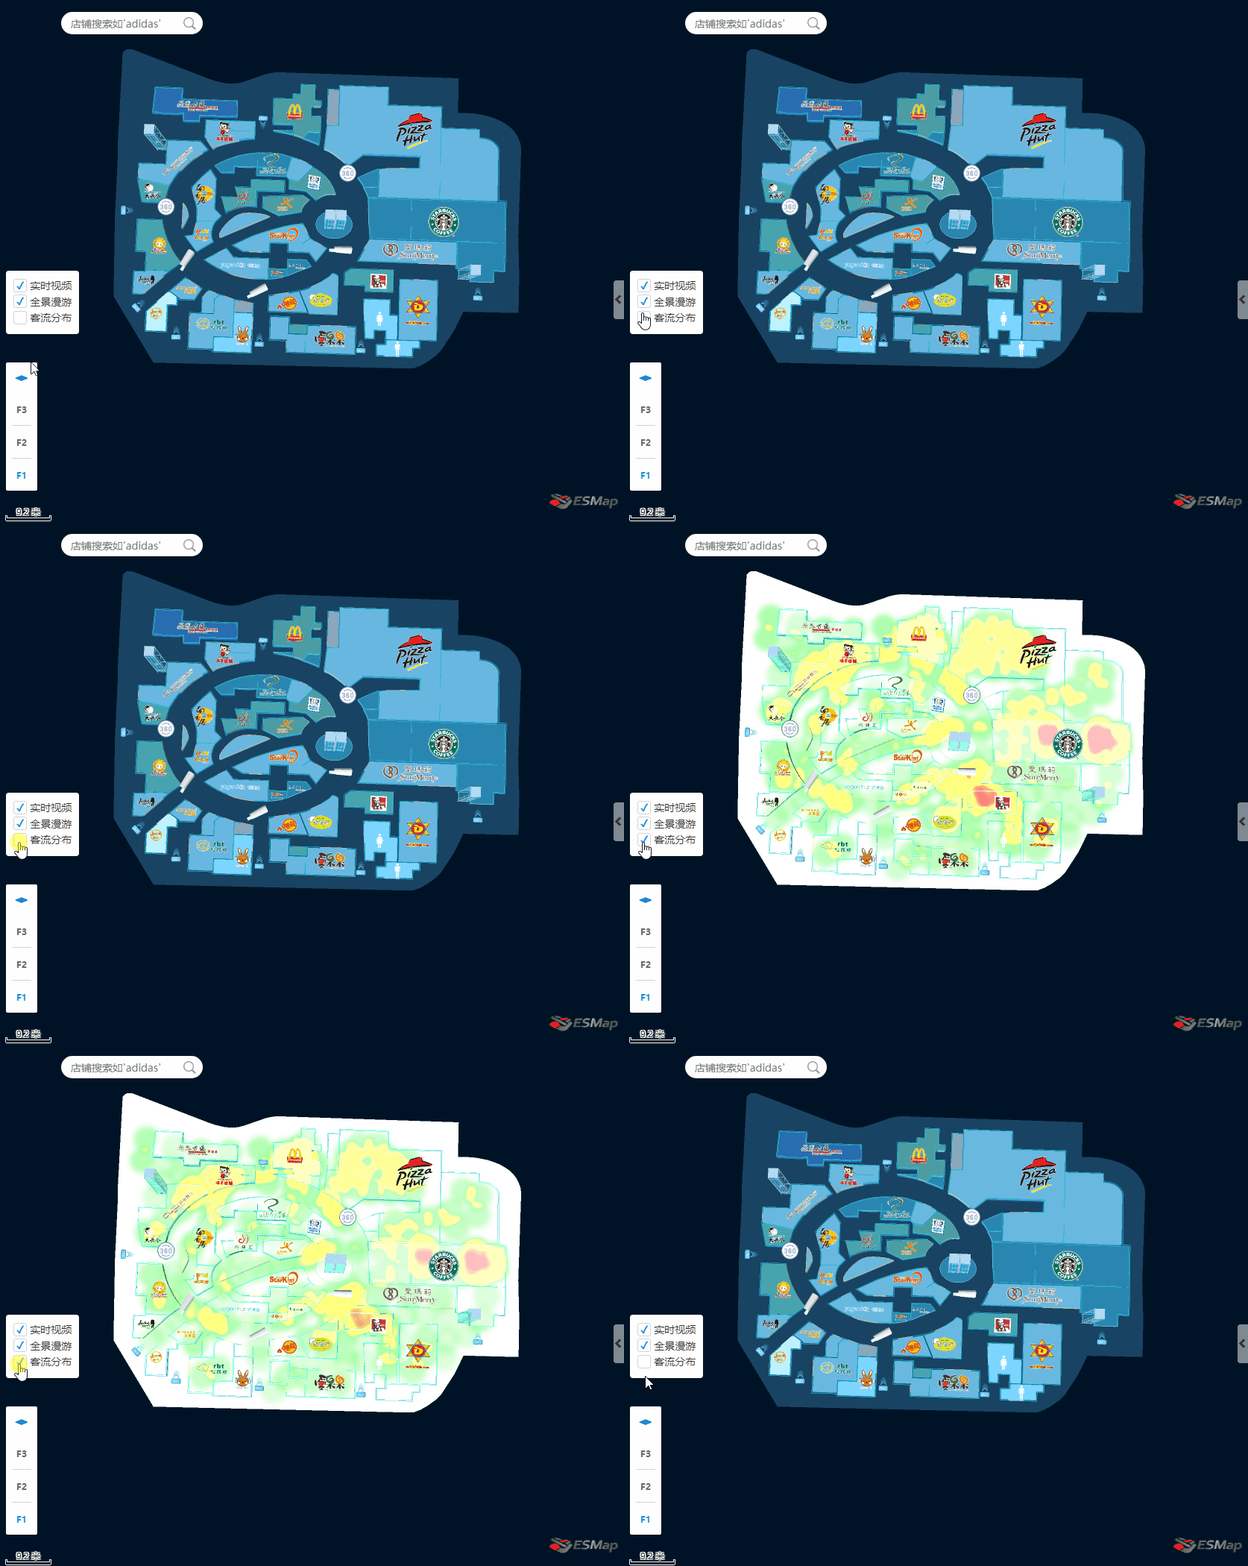
(1)客流分佈熱力圖功能,以下載入的是模擬數據,投入使用後可直接載入實際數據,根據數據體現熱力圖的情況。
//添加熱力圖,根據json文件
function addHeatMap() {
    // 創建熱力圖對象
    if (!heatmapInstance)
        heatmapInstance = esmap.ESHeatMap.create(map, {
            radius: 24, //熱點半徑
            opacity: .5, //熱力圖透明度
            max: 35, //熱力點value的最大值
            maxSize: 2048,
            gradient: {//漸變色值,可配
                0.35: "green",
                0.5: "yellow",
                0.7: "orange",
                0.85: "red"
            }
    $.getJSON("data/003.json", function(data) { //數據載入
        var datas = data.datas;
        var len = datas.length;
        exec(datas[0]["data"][0]["fnum"], datas[0]["data"][0]["points"]);//繪製熱力圖
        var index = 1;
        timer1 = setInterval(function () {
            if (index > 1) index = 0;
            for (var el of datas[0]["data"][0]["points"]) {
                switch (index) {
                    case 0: el.value = el.value - 1;
                    break;
                    case 1: el.value = el.value + 1;
                    break;
                }
            }
            exec(datas[0]["data"][0]["fnum"], datas[0]["data"][0]["points"]);
            index++;
        }, 2000)
        return;
    });
    function exec(fnum, points) {//繪製熱力圖函數
        var floorLayer = map.getFloor(fnum);//獲取應用樓層
        heatmapInstance.clearPoints();//清除熱力點
        heatmapInstance.addPoints(points);//熱力點添加到熱力圖
        //熱力圖應用到哪一樓層
        floorLayer.applyHeatMap(heatmapInstance);
    }
}
熱力圖如下:

(2)實時視頻及全景漫游的實現:
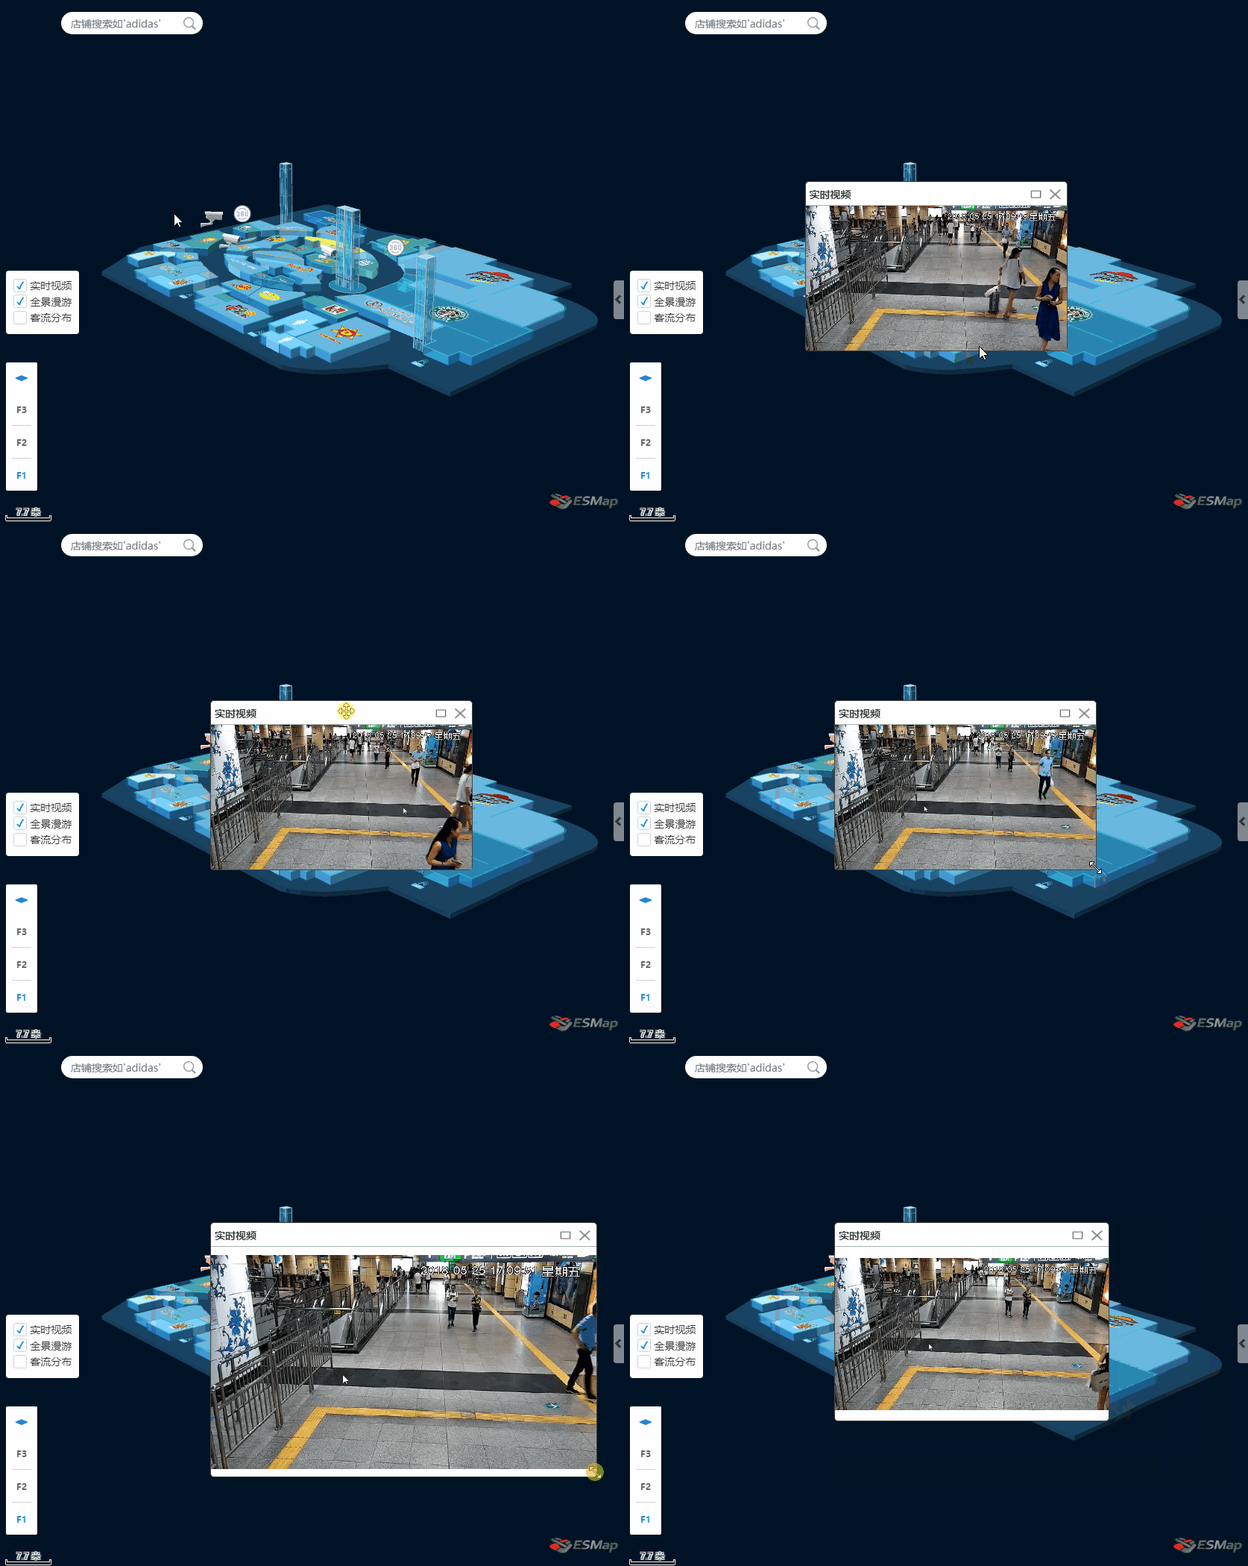
首先創建實時視頻的攝像頭圖片標註和全景漫游的360°圖片標註,標註實現後可在地圖上點擊相應的圖片標註從而顯示實時視頻畫面或360°全景畫面,畫面可拖拽可放大縮小。
各樓層實時視頻的攝像頭圖片標註:
//創建各樓層攝像頭標註
function showCameras() {
    var url = 'data/test666/model/camera1.js';
    //json數據,定義攝像頭所在樓層和位置
    var infos = [{
        fnum: 1,
        cameras: [{
                x: 12683472.409512023,
                y: 2557870.1781415385,
            },
            {
                x: 12683450.258123305,
                y: 2557858.104209115
            },
            {
                x: 12683430.863774385,
                y: 2557865.8999765064
            }
        ]
    }, {
        fnum: 2,
        cameras: [{
                x: 12683472.409512023,
                y: 2557870.1781415385,
            },
            {
                x: 12683450.258123305,
                y: 2557858.104209115
            },
            {
                x: 12683430.863774385,
                y: 2557865.8999765064
            }
        ]
    }, {
        fnum: 3,
        cameras: [{
                x: 12683472.409512023,
                y: 2557870.1781415385,
            },
            {
                x: 12683450.258123305,
                y: 2557858.104209115
            },
            {
                x: 12683430.863774385,
                y: 2557865.8999765064
            }
        ]
    }];
    //創建三維模型標註  實時視頻攝像頭
    var ang = 0;
    infos.forEach(function (info) {
        var floorLayer = map.getFloor(info.fnum);
        var layer = floorLayer.getOrCreateLayerByName("cameras", esmap.ESLayerType.MODEL3D);
        var _id = 1;
        info.cameras.forEach(function (camera) {
            var im = new esmap.ES3DMarker({
                x: camera.x,
                y: camera.y,
                id: _id++,
                name: "camera",
                url: url,
                size: 44,
                angle: ang,
                height: 3,
                showLevel: 16,
                spritify: true
            });
            ang += 30;
            layer.addMarker(im);//一個樓層共用一個圖層
        });
        layer && layer.show3D();
    });
}
點擊地圖展示實時視頻或全景漫游彈框(div)函數active():
//地圖點擊標註後  臨時創建div盒子  放全景圖或實時視頻
function active(e, type) { // type: 1.pano; 0.video
var cc = $($(".drag")[0]).clone();
    var wid = $(".drag").width();

    $("body").append(cc);
    cc[0].style.display = "block";
    if (__xx < wid) {
        __xx = wid;
    }
    cc[0].style.left = (__xx - wid - 20).toString() + "px";
    cc[0].style.top = (__yy - 25 / 2).toString() + "px";

    if (!type) {
        cc.find('.content')[0].innerHTML = '<video class="video_" src="videos/' + e.id_ + '.mp4" autoplay loop></video>';
        cc.find('.title h2')[0].innerHTML = '實時視頻';
        createPopBox();
    } else {
        cc.find('.title h2')[0].innerHTML = '全景展示';

        var box = document.createElement('div');

        cc.find('.content').append(box);
        box.className = 'psv-box';

        oPano = new CreatePanorama({
            container: box,
            panorama: 'image/pano/' + e.id + '/',
            six: 1
        })
        createPopBox(oPano);
    }
}
展示的彈框可拖拽、大小可調整,功能實現如下函數:
/*可拖拽可放大縮小彈框*/
function createPopBox(pano) { // pano: 0.視頻,1.全景
    /*-------------------------- +
    獲取id, class, tagName 函數
    +-------------------------- */
    var get = {
        byId: function (id) {
            return typeof id === "string" ? document.getElementById(id) : id;
        },
        byClass: function (sClass, oParent) {
            var aClass = [];
            var reClass = new RegExp("(^| )" + sClass + "( |$)");
            var aElem = this.byTagName("*", oParent);
            for (var i = 0; i < aElem.length; i++) reClass.test(aElem[i].className) && aClass.push(aElem[i]);
            return aClass
        },
        byTagName: function (elem, obj) {
            return (obj || document).getElementsByTagName(elem);
        }
    };
    var dragMinWidth = 250;
    var dragMinHeight = 173;
    /*-------------------------- +
    拖拽函數
    +-------------------------- */
    function drag(oDrag, handle) {
        var disX = dixY = 0;
        var oMax = get.byClass("max", oDrag)[0];//獲取最大化div的 class
        var oRevert = get.byClass("revert", oDrag)[0];//獲取恢復div的 class
        var oClose = get.byClass("close", oDrag)[0];//獲取關閉div的  class
        handle = handle || oDrag;
        handle.style.cursor = "move";
        handle.onmousedown = function (event) {
            var event = event || window.event;
            disX = event.clientX - oDrag.offsetLeft;
            disY = event.clientY - oDrag.offsetTop;

            document.onmousemove = function (event) {
                var event = event || window.event;
                var iL = event.clientX - disX;
                var iT = event.clientY - disY;
                var maxL = document.documentElement.clientWidth - oDrag.offsetWidth;
                var maxT = document.documentElement.clientHeight - oDrag.offsetHeight;

                iL <= 0 && (iL = 0);
                iT <= 0 && (iT = 0);
                iL >= maxL && (iL = maxL);
                iT >= maxT && (iT = maxT);

                oDrag.style.left = iL + "px";
                oDrag.style.top = iT + "px";

                return false
            };
            document.onmouseup = function () {
                document.onmousemove = null;
                document.onmouseup = null;
                this.releaseCapture && this.releaseCapture()
            };
            this.setCapture && this.setCapture();
            return false
        };
        //最大化按鈕
        oMax.onclick = function () {
            if (!pano) {
                $(this).parents('.drag').find('.video_')[0].webkitEnterFullscreen(true);
            } else {
                fullPano = 1;
                oDrag.classList.add('over-auto');
                var _box = $(oDrag).find('.psv-box')[0];

                _box.classList.add('psv-full', 'over-auto');

                var _div = document.createElement('div');
                document.body.append(_div);
                _div.className = 'psv-full-btns';
                _div.innerHTML = '<a class="full-revert" href="javascript:;" title="還原"></a>'

                document.onkeydown = function (e) {
                    if (e.keyCode == 27 && fullPano == 1) {
                        fullPano = 0;
                        oDrag.classList.remove('over-auto');
                        _box.classList.remove('psv-full', 'over-auto');
                        _div.remove();
                        pano.onWindowResize();
                    }
                }

                $(_div).find('.full-revert').click(function () {
                    fullPano = 0;
                    oDrag.classList.remove('over-auto');
                    _box.classList.remove('psv-full', 'over-auto');
                    _div.remove();
                    pano.onWindowResize();
                })

                pano.onWindowResize();
            }
        };
        //還原按鈕
        oRevert.onclick = function () {
            oDrag.style.width = dragMinWidth + "px";
            oDrag.style.height = dragMinHeight + "px";
            oDrag.style.left = (document.documentElement.clientWidth - oDrag.offsetWidth) / 2 + "px";
            oDrag.style.top = (document.documentElement.clientHeight - oDrag.offsetHeight) / 2 + "px";
            this.style.display = "none";
            oMax.style.display = "block";
            pano && pano.onWindowResize();
        };
        //關閉按鈕
        oClose.onclick = function () {
            if (!pano) {
                $(this).parents('.drag').remove();
            } else {
                oPano = null;
                $(this).parents('.drag').remove();
            }
        };
        //阻止冒泡
        oMax.onmousedown = oClose.onmousedown = function (event) {
            this.onfocus = function () {
                this.blur();
            };
            (event || window.event).cancelBubble = true
        };
    }
    /*-------------------------- +
    改變大小函數
    +-------------------------- */
    function resize(oParent, handle, isLeft, isTop, lockX, lockY) {
        handle.onmousedown = function (event) {
            var event = event || window.event;
            var disX = event.clientX - handle.offsetLeft;
            var disY = event.clientY - handle.offsetTop;
            var iParentTop = oParent.offsetTop;
            var iParentLeft = oParent.offsetLeft;
            var iParentWidth = oParent.offsetWidth;
            var iParentHeight = oParent.offsetHeight;

            document.onmousemove = function (event) {
                var event = event || window.event;

                var iL = event.clientX - disX;
                var iT = event.clientY - disY;
                var maxW = document.documentElement.clientWidth - oParent.offsetLeft - 2;
                var maxH = document.documentElement.clientHeight - oParent.offsetTop - 2;
                var iW = isLeft ? iParentWidth - iL : handle.offsetWidth + iL;
                var iH = isTop ? iParentHeight - iT : handle.offsetHeight + iT;

                isLeft && (oParent.style.left = iParentLeft + iL + "px");
                isTop && (oParent.style.top = iParentTop + iT + "px");

                iW < dragMinWidth && (iW = dragMinWidth);
                iW > maxW && (iW = maxW);
                lockX || (oParent.style.width = iW + "px");

                iH < dragMinHeight && (iH = dragMinHeight);
                iH > maxH && (iH = maxH);
                lockY || (oParent.style.height = iH + "px");

                if ((isLeft && iW == dragMinWidth) || (isTop && iH == dragMinHeight)) document.onmousemove = null;

                pano && pano.onWindowResize();

                return false;
            };
            document.onmouseup = function () {
                document.onmousemove = null;
                document.onmouseup = null;
            };
            return false;
        }
    };
    function aaa() {
        var dom = document.getElementsByClassName("drag");
        var oDrag = dom[dom.length - 1];

        var oTitle = get.byClass("title", oDrag)[0];
        var oL = get.byClass("resizeL", oDrag)[0];
        var oT = get.byClass("resizeT", oDrag)[0];
        var oR = get.byClass("resizeR", oDrag)[0];
        var oB = get.byClass("resizeB", oDrag)[0];

        var oLT = get.byClass("resizeLT", oDrag)[0];
        var oTR = get.byClass("resizeTR", oDrag)[0];
        var oBR = get.byClass("resizeBR", oDrag)[0];
        var oLB = get.byClass("resizeLB", oDrag)[0];

        drag(oDrag, oTitle);
        //拉四角
        resize(oDrag, oLT, true, true, false, false);
        resize(oDrag, oTR, false, true, false, false);
        resize(oDrag, oBR, false, false, false, false);
        resize(oDrag, oLB, true, false, false, false);
        //拉四邊
        resize(oDrag, oL, true, false, false, true);
        resize(oDrag, oT, false, true, true, false);
        resize(oDrag, oR, false, false, false, true);
        resize(oDrag, oB, false, false, true, false);

        oDrag.style.left = (document.documentElement.clientWidth - oDrag.offsetWidth) / 2 + "px";
        oDrag.style.top = (document.documentElement.clientHeight - oDrag.offsetHeight) / 2 + "px";
    }
    aaa();
}
功能都實現後投入使用,點擊地圖上的標註顯示相應的實時視頻,這裡我使用了ESMap的地圖點擊事件map.on(“mapClickNode”,function(){});
 map.on("mapClickNode", function (e) {
        removeAll();
        if (e.nodeType && e.nodeType == 31 && e.name && e.name == 'myMarker') {//全景
            active(e, 1);
        }
        if (e.nodeType && e.nodeType == 6 && e.name && e.name == 'camera') {//視頻
            active(e)
        }
        if (e.nodeType && e.nodeType == 5) {//點擊地圖商鋪顯示相應運營情況
            if (e.name) {
                var obj = {
                    id: e.ID,
                    fnum: e.FloorNum,
                    x: e.x,
                    y: e.y,
                    name: e.name
                }
                searchClick(obj);// 函數如下
} } })
封裝氣泡標註函數searchClick(),顯示商鋪信息:
function searchClick(data, isAddImageMarker) {
    if (!data.name) return;
    // 添加pop
    removeAll();
    var floorLayer = map.getFloor(data.fnum);

    if (isAddImageMarker) {
        floorControl.changeFocusFloor(data.fnum);
    }
    if (data.name == '房間') {
        var dom = '<div class="pop-content"><strong>房間 ' + data.id + '</strong><p>經度:' + data.x.toFixed(3) + '</p><p>緯度:' + data.y.toFixed(3) + '</p></div>';
    } else {
        var shopDatas = getShopMsg(data.id);//數字number
        var dom = '<div class="pop-content"><strong>' + data.name + '</strong><p>人流量:' + shopDatas.msgA + '</p><p>營業額:' + shopDatas.msgB + '</p></div>'
    }
    //添加信息窗
    popMarker = new esmap.ESPopMarker({
        mapCoord: {
            //設置彈框的x軸
            x: data.x,
            //設置彈框的y軸
            y: data.y,
            height: 1, //控制信息窗的高度
            //設置彈框位於的樓層
            fnum: data.fnum
        },
        //設置彈框的寬度
        width: 200,
        //設置彈框的高度
        height: 120,
        marginTop: 10,
        //設置彈框的內容
        content: dom,
        // content: '<input id="pop-input" type="text"/>',
        closeCallBack: function () {
            //信息窗點擊關閉操作
            // alert('信息窗關閉了!');
        },
    });
    $(".es-control-popmarker input").val('✖'); // 手動添加close按鈕value
}
效果圖如下:

各樓層全景漫游的360°圖片標註:
//創建360°圖片標註到各層
function showImageMarker() {
    var _arr = [{
        fnum: 1,
        node: [{
                x: 12683473.823037906,
                y: 2557891.805802924,
            },
            {
                x: 12683424.1333389,
                y: 2557880.7494297,
            }
        ]
    }, {
        fnum: 2,
        node: [{
                x: 12683473.823037906,
                y: 2557891.805802924,
            },
            {
                x: 12683424.1333389,
                y: 2557880.7494297,
            }
        ]
    }, {
        fnum: 3,
        node: [{
                x: 12683473.823037906,
                y: 2557891.805802924,
            },
            {
                x: 12683424.1333389,
                y: 2557880.7494297,
            }
        ]
    }]
    for (var el of _arr) {
        var floorLayer = map.getFloor(el.fnum);
        var im_layer = new esmap.ESLayer('im


