一、前言 LLDB是個開源的內置於XCode的具有REPL(read-eval-print-loop)特征的Debugger,其可以安裝C++或者Python插件。在日常的開發和調試過程中給開發人員帶來了非常多的幫助。瞭解並熟練掌握LLDB的使用是非常有必要的。這篇文章將會帶著大家一起瞭解在iOS開 ...
一、前言
LLDB是個開源的內置於XCode的具有REPL(read-eval-print-loop)特征的Debugger,其可以安裝C++或者Python插件。在日常的開發和調試過程中給開發人員帶來了非常多的幫助。瞭解並熟練掌握LLDB的使用是非常有必要的。這篇文章將會帶著大家一起瞭解在iOS開發中LLDB調試器的使用。
二、LLDB基礎
2.1 LLDB基本語法
LLDB的基本語法如下
<command> [<subcommand> [<subcommand>...]] <action> [-options [option-value]] [argument [argument...]]
- <command>(命令)和<subcommand>(子命令):LLDB調試命令的名稱。命令和子命令按層級結構來排列:一個命令對象為跟隨其的子命令對象創建一個上下文,子命令又為其子命令創建一個上下文,依此類推。
- <action>:執行命令的操作
- <options>:命令選項
- <arguement>:命令的參數
- []:表示命令是可選的,可以有也可以沒有
舉個例子,假設我們給main方法設置一個斷點,我們使用下麵的命令:
這個命令對應到上面的語法就是:
1. command: breakpoint 表示斷點命令
2. action: set 表示設置斷點
3. option: -n 表示根據方法name設置斷點
4. arguement: mian 表示方法名為mian
2.2 LLDB的基本使用
2.2.1 Help命令
LLDB其中內置了非常多的功能,選擇去硬背每一條指令並不是一個明智的選擇。我們只需要記住一些常用的指令,在需要的時候通過help命令來查看相關的描述即可。
(lldb) help
Debugger commands:
  apropos           -- List debugger commands related to a word or subject.
  breakpoint        -- Commands for operating on breakpoints (see 'help b' for
                       shorthand.)
  bugreport         -- Commands for creating domain-specific bug reports.
  command           -- Commands for managing custom LLDB commands.
  disassemble       -- Disassemble specified instructions in the current
                       target.  Defaults to the current function for the
                       current thread and stack frame.
  expression        -- Evaluate an expression on the current thread.  Displays
                       any returned value with LLDB's default formatting.
  frame             -- Commands for selecting and examing the current thread's
                       stack frames.
  gdb-remote        -- Connect to a process via remote GDB server.  If no host
                       is specifed, localhost is assumed.
  gui               -- Switch into the curses based GUI mode.
  help              -- Show a list of all debugger commands, or give details
                       about a specific command.
......
我們要查看某一個命令改如何使用時,可以使用 help <command> 來獲取對應命令的使用方法。
(lldb) help expression
     Evaluate an expression on the current thread.  Displays any returned value
     with LLDB's default formatting.  Expects 'raw' input (see 'help
     raw-input'.)

Syntax: expression <cmd-options> -- <expr>

Command Options Usage:
  expression [-AFLORTgp] [-f <format>] [-G <gdb-format>] [-a <boolean>] [-i <boolean>] [-t <unsigned-integer>] [-u <boolean>] [-l <source-language>] [-X <boolean>] [-v[<description-verbosity>]] [-j <boolean>] [-d <none>] [-S <boolean>] [-D <count>] [-P <count>] [-Y[<count>]] [-V <boolean>] [-Z <count>] -- <expr>
  expression [-AFLORTgp] [-a <boolean>] [-i <boolean>] [-t <unsigned-integer>] [-u <boolean>] [-l <source-language>] [-X <boolean>] [-j <boolean>] [-d <none>] [-S <boolean>] [-D <count>] [-P <count>] [-Y[<count>]] [-V <boolean>] [-Z <count>] -- <expr>
  expression [-r] -- <expr>
  expression <expr>

       -A ( --show-all-children )
            Ignore the upper bound on the number of children to show.

       -D <count> ( --depth <count> )
            Set the max recurse depth when dumping aggregate types (default is
            infinity).

。。。。。。

Examples:

    expr my_struct->a = my_array[3]
    expr -f bin -- (index * 8) + 5
    expr unsigned int $foo = 5
    expr char c[] = \"foo\"; c[0]

     Important Note: Because this command takes 'raw' input, if you use any
     command options you must use ' -- ' between the end of the command options
     and the beginning of the raw input.
2.2.2 expression命令
expression命令的作用是執行一個表達式,並將表達式返回的結果輸出。expression的完整語法是這樣的 :
expression <cmd-options> -- <expr>

//<cmd-options>:命令選項,一般情況下使用預設的即可,不需要特別標明。
//--: 命令選項結束符,表示所有的命令選項已經設置完畢,如果沒有命令選項,--可以省略
//<expr>: 要執行的表達式
說expression是LLDB裡面最重要的命令都不為過。因為他能實現2個功能。
-
執行某個表達式。 我們在代碼運行過程中,可以通過執行某個表達式來動態改變程式運行的軌跡。 假如我們在運行過程中,突然想把self.view顏色改成紅色,看看效果。我們不必寫下代碼,重新run,只需暫停程式,用expression改變顏色,再刷新一下界面,就能看到效果
// 改變顏色
 (lldb) expression -- self.view.backgroundColor = [UIColor redColor]
 // 刷新界面
 (lldb) expression -- (void)[CATransaction flush]
-
將返回值輸出。 也就是說我們可以通過expression來列印東西。 假如我們想列印self.view
(lldb) expression self.view
(UIView *) $0 = 0x00007f8ed7418480
(lldb) expression -- self.view
(UIView *) $1 = 0x00007f8ed7418480
2.2.3 p & print & call & po 命令
一般情況下,我們直接用expression還是用得比較少的,更多時候我們用的是p、print、call。這三個命令其實都是 expression -- 的別名(--表示不再接受命令選項,詳情見前面原始(raw)命令這一節):
-
print: 列印某個東西,可以是變數和表達式
-
p: 可以看做是print的簡寫
- po:OC里所有的對象都是用指針表示的,所以一般列印的時候,列印出來的是對象的指針,而不是對象本身。如果我們想列印對象。我們需要使用命令選項:-O。為了更方便的使用,LLDB為expression -O –定義了一個別名:po。
p列印的是當前對象的地址而po則會調用對象的description方法,做法和NSLog是一致的 -
call: 調用某個方法
錶面上看起來他們可能有不一樣的地方,實際都是執行某個表達式(變數也當做表達式),將執行的結果輸出到控制臺上。所以你可以用p調用某個方法,也可以用call列印東西 e.g: 下麵代碼效果相同:
(lldb) expression -- self.view
(UIView *) $5 = 0x00007fb2a40344a0
(lldb) p self.view
(UIView *) $6 = 0x00007fb2a40344a0
(lldb) print self.view
(UIView *) $7 = 0x00007fb2a40344a0
(lldb) call self.view
(UIView *) $8 = 0x00007fb2a40344a0
(lldb) e self.view
(UIView *) $9 = 0x00007fb2a40344a0
(lldb) expression -O -- self.view
<UIView: 0x7fb2a40344a0; frame = (0 0; 375 667); autoresize = W+H; layer = <CALayer: 0x7fb2a4018c80>>
(lldb) po self.view
<UIView: 0x7fb2a40344a0; frame = (0 0; 375 667); autoresize = W+H; layer = <CALayer: 0x7fb2a4018c80>>
2.2.4 thread backtrace命令
有時候我們想要瞭解線程堆棧信息,可以使用thread backtrace thread backtrace作用是將線程的堆棧列印出來。我們來看看他的語法 :
thread backtrace [-c <count>] [-s <frame-index>] [-e <boolean>]

/*
   * thread backtrace後面跟的都是命令選項,實際上這些命令選項我們一般不需要使用。
    -c:設置列印堆棧的幀數(frame)
    -s:設置從哪個幀(frame)開始列印
    -e:是否顯示額外的回溯
*/
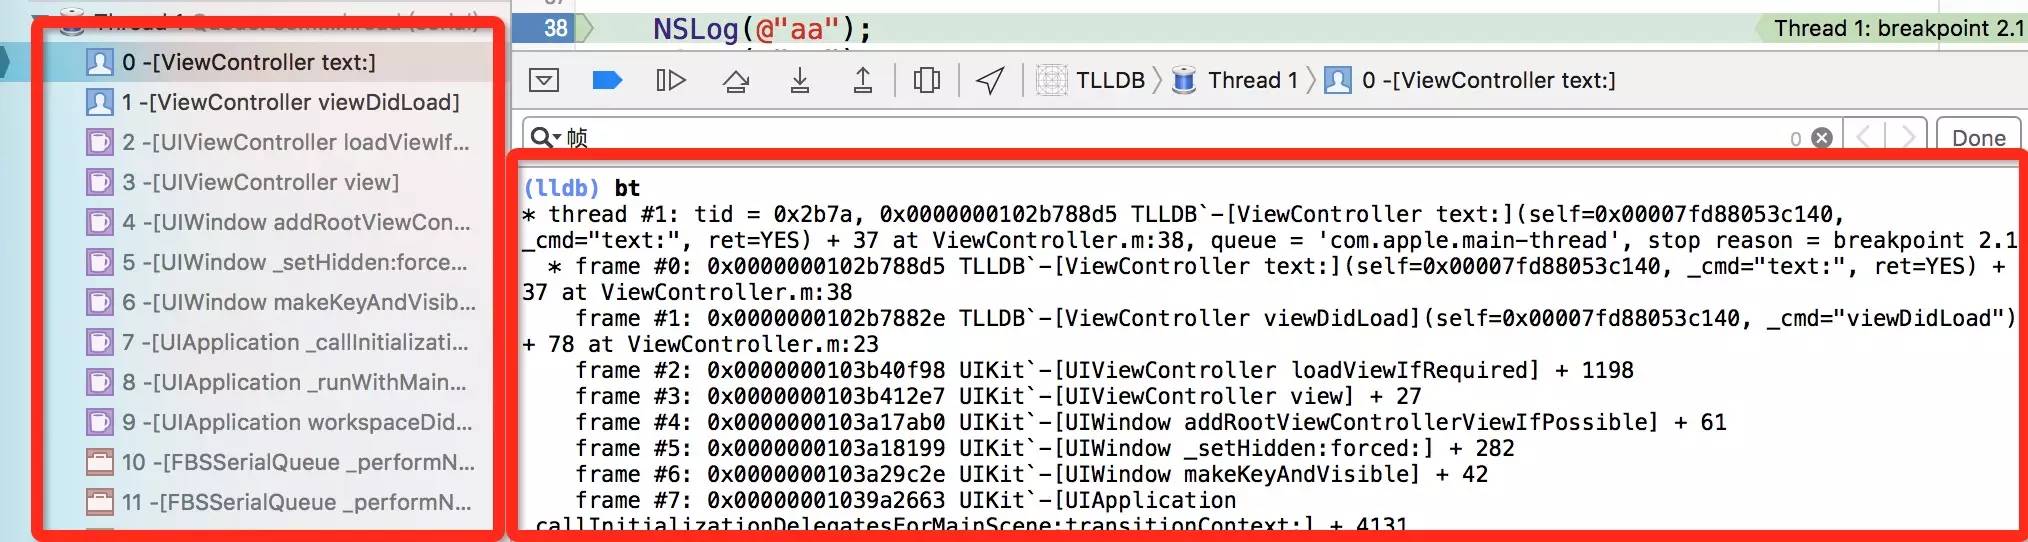
e.g: 當發生crash的時候,我們可以使用thread backtrace查看堆棧調用。從下麵的結果中,我們可以看到crash發生在-[ViewController viewDidLoad]中的第23行,只需檢查這行代碼是不是幹了什麼非法的事兒就可以了。
(lldb) thread backtrace
* thread #1: tid = 0xdd42, 0x000000010afb380b libobjc.A.dylib`objc_msgSend + 11, queue = 'com.apple.main-thread', stop reason = EXC_BAD_ACCESS (code=EXC_I386_GPFLT)
    frame #0: 0x000000010afb380b libobjc.A.dylib`objc_msgSend + 11
  * frame #1: 0x000000010aa9f75e TLLDB`-[ViewController viewDidLoad](self=0x00007fa270e1f440, _cmd="viewDidLoad") + 174 at ViewController.m:23
    frame #2: 0x000000010ba67f98 UIKit`-[UIViewController loadViewIfRequired] + 1198
    frame #3: 0x000000010ba682e7 UIKit`-[UIViewController view] + 27
    frame #4: 0x000000010b93eab0 UIKit`-[UIWindow addRootViewControllerViewIfPossible] + 61
    frame #5: 0x000000010b93f199 UIKit`-[UIWindow _setHidden:forced:] + 282
    frame #6: 0x000000010b950c2e UIKit`-[UIWindow makeKeyAndVisible] + 42
此外,LLDB還為backtrace專門定義了一個別名:bt,他的效果與thread backtrace相同,如果你不想寫那麼長一串字母,直接寫下bt即可
2.2.5 thread return命令
Debug的時候,也許會因為各種原因,我們不想讓代碼執行某個方法,或者要直接返回一個想要的值。這時候就該thread return上場了。thread return可以接受一個表達式,調用命令之後直接從當前的frame返回表達式的值。
thread return [<expr>]
e.g: 我們有一個someMethod方法,預設情況下是返回YES。我們想要讓他返回NO。我們只需在方法的開始位置加一個斷點,當程式中斷的時候,輸入命令即可,效果相當於在斷點位置直接調用return NO;,不會執行斷點後面的代碼。

(lldb) thread return NO
2.2.6 thread其他不常用的命令
thread 相關的還有其他一些不常用的命令,這裡就簡單介紹一下即可,如果需要瞭解更多,可以使用命令help thread查閱
-
thread jump: 直接讓程式跳到某一行。由於ARC下編譯器實際插入了不少retain,release命令。跳過一些代碼不執行很可能會造成對象記憶體混亂髮生crash。
-
thread list: 列出所有的線程
-
thread select: 選擇某個線程
-
thread until: 傳入一個line的參數,讓程式執行到這行的時候暫停
-
thread info: 輸出當前線程的信息
2.2.7 c & n & s & finish命令
一般在調試程式的時候,我們經常用到下麵這4個按鈕:
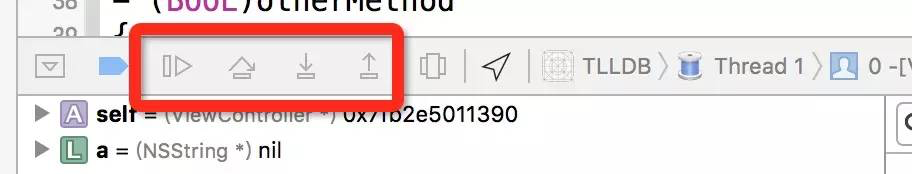
用觸摸板的孩子們可能會覺得點擊這4個按鈕比較費勁。其實LLDB命令也可以完成上面的操作,而且如果不輸入命令,直接按Enter鍵,LLDB會自動執行上次的命令。按一下Enter就能達到我們想要的效果,有木有頓時感覺逼格滿滿的!!! 我們來看看對應這4個按鈕的LLDB命令:
-
c/ continue/ thread continue: 這三個命令效果都等同於上圖中第一個按鈕的。表示程式繼續運行
-
n/ next/ thread step-over: 這三個命令效果等同於上圖第二個按鈕。表示單步運行
-
s/ step/ thread step-in: 這三個命令效果等同於上圖第三個按鈕。表示進入某個方法
-
finish/ step-out: 這兩個命令效果等同於第四個按鈕。表示直接走完當前方法,返回到上層frame
2.2.8 frame命令
前面我們提到過很多次frame(幀)。可能有的朋友對frame這個概念還不太瞭解。隨便打個斷點,我們在控制臺上輸入命令bt,可以列印出來所有的frame。如果仔細觀察,這些frame和左邊紅框里的堆棧是一致的。平時我們看到的左邊的堆棧就是frame。
- frame variable:平時Debug的時候我們經常做的事就是查看變數的值,通過frame variable命令,可以列印出當前frame的所有變數
(lldb) frame variable
(ViewController *) self = 0x00007fa158526e60
(SEL) _cmd = "text:"
(BOOL) ret = YES
(int) a = 3
- frame variable 參數:如果我們要需要列印指定變數,也可以給frame variable傳入參數。不過frame variable只接受變數作為參數,不接受表達式,也就是說我們無法使用frame variable self.string,因為self.string是調用string的getter方法。所以一般列印指定變數,我更喜歡用p或者po。
(lldb) frame variable self->_string (NSString *) self->_string = nil - frame info: 查看當前frame的信息
(lldb) frame info
frame #0: 0x0000000101bf87d5 TLLDB`-[ViewController text:](self=0x00007fa158526e60, _cmd="text:", ret=YES) + 37 at ViewController.m:38
- frame select: 選擇某個frame,當我們選擇frame 1的時候,他會把frame1的信息和代碼列印出來。不過一般我都是直接在Xcode左邊點擊某個frame,這樣更方便
(lldb) frame select 1
frame #1: 0x0000000101bf872e TLLDB`-[ViewController viewDidLoad](self=0x00007fa158526e60, _cmd="viewDidLoad") + 78 at ViewController.m:23

         - (void)viewDidLoad {
             [super viewDidLoad];
            [self text:YES];
            NSLog(@"1");
            NSLog(@"2");
            NSLog(@"3");
2.2.9 breakpoint命令
- breakpoint set:設置斷點,LLDB提供了很多種設置斷點的方式
- 使用-n根據方法名設置斷點
//我們想給所有類中的viewWillAppear:設置一個斷點
(lldb) breakpoint set -n viewWillAppear:
    Breakpoint 13: 33 locations.
- 使用-f指定文件
// 我們只需要給ViewController.m文件中的viewDidLoad設置斷點
(lldb) breakpoint set -f ViewController.m -n viewDidLoad
    Breakpoint 22: where = TLLDB`-[ViewController viewDidLoad] + 20 at ViewController.m:22, address = 0x000000010272a6f4
- 使用-l指定文件某一行設置斷點
//我們想給ViewController.m第38行設置斷點
(lldb) breakpoint set -f ViewController.m -l 38
Breakpoint 23: where = TLLDB`-[ViewController text:] + 37 at ViewController.m:38, address = 0x000000010272a7d5
- 使用-c設置條件斷點
//text:方法接受一個ret的參數,我們想讓ret == YES的時候程式中斷
(lldb) breakpoint set -n text: -c ret == YES
Breakpoint 7: where = TLLDB`-[ViewController text:] + 30 at ViewController.m:37, address = 0x0000000105ef37ce
- 使用-o設置單次斷點
//如果剛剛那個斷點我們只想讓他中斷一次
(lldb) breakpoint set -n text: -o
'breakpoint 3': where = TLLDB`-[ViewController text:] + 30 at ViewController.m:37, address = 0x000000010b6f97ce
- 使用-n根據方法名設置斷點
- breakpoint command add:就是給斷點添加命令的命令。多次對同一個斷點添加命令,後面命令會將前面命令覆蓋
 //假設我們需要在ViewController的viewDidLoad中查看self.view的值 我們首先給-[ViewController viewDidLoad]添加一個斷點
(lldb) breakpoint set -n "-[ViewController viewDidLoad]"
'breakpoint 3': where = TLLDB`-[ViewController viewDidLoad] + 20 at ViewController.m:23, address = 0x00000001055e6004

/*
    可以看到添加成功之後,這個breakpoint的id為3,然後我們給他增加一個命令:po self.view
    -o完整寫法是--one-liner,表示增加一條命令。3表示對id為3的breakpoint增加命令。 添加完命令之後,每次程式執行到這個斷點就可以自動列印出self.view的值了
*/
(lldb) breakpoint command add -o "po self.view" 3

/*
    如果我們一下子想增加多條命令,比如我想在viewDidLoad中列印當前frame的所有變數,但是我們不想讓他中斷,也就是在列印完成之後,需要繼續執行。我們可以這樣玩
    輸入breakpoint command add 3對斷點3增加命令。他會讓你輸入增加哪些命令,輸入’DONE’表示結束。這時候你就可以輸入多條命令了
*/
(lldb) breakpoint command add 3
Enter your debugger command(s).  Type 'DONE' to end.
> frame variable
> continue
> DONE
- breakpoint command list:查看某個斷點已有的命令
//我們查看一下剛剛的斷點3已有的命令
(lldb) breakpoint command list 3
'breakpoint 3':
    Breakpoint commands:
      frame variable
      continue
- breakpoint command delete:有增加就有刪除,breakpoint command delete可以讓我們刪除某個斷點的命令
- breakpoint list:查看已經設置了哪些斷點
- breakpoint disable/enable:有的時候我們可能暫時不想要某個斷點,可以使用breakpoint disable讓某個斷點暫時失效,使用breakpoint enable再次讓他生效。
- breakpoint delete:如果我們覺得這個斷點以後再也用不上了,可以用breakpoint delete直接刪除斷點
//刪除斷點4
(lldb) breakpoint delete 4
1 breakpoints deleted; 0 breakpoint locations disabled.

//如果我們想刪除所有斷點,只需要不指定breakpoint delete參數即可
(lldb) breakpoint delete
About to delete all breakpoints, do you want to do that?: [Y/n] y
All breakpoints removed. (1 breakpoint)

//刪除的時候他會提示你,是不是真的想刪除所有斷點,需要你再次輸入Y確認。如果想直接刪除,不需要他的提示,使用-f命令選項即可
(lldb) breakpoint delete -f
All breakpoints removed. (1 breakpoint)
實際平時我們真正使用breakpoint命令反而比較少,因為Xcode已經內置了斷點工具。我們可以直接在代碼上打斷點,可以在斷點工具欄裡面查看編輯斷點,這比使用LLDB命令方便很多。不過瞭解LLDB相關命令可以讓我們對斷點理解更深刻。 如果你想瞭解怎麼使用Xcode設置斷點,可以閱讀這篇文章《Xcode中斷點的威力》
2.2.10 watchpoint命令
breakpoint有一個孿生兄弟watchpoint。如果說breakpoint是對方法生效的斷點,watchpoint就是對地址生效的斷點。如果我們想要知道某個屬性什麼時候被篡改了,我們該怎麼辦呢?有人可能會說對setter方法打個斷點不就行了麽?但是如果更改的時候沒調用setter方法呢? 這時候最好的辦法就是用watchpoint。我們可以用他觀察這個屬性的地址。如果地址裡面的東西改變了,就讓程式中斷
- watchpoint set:用於添加一個watchpoint。只要這個地址中的內容變化了,程式就會中斷。
- watchpoint set variable:一般情況下,要觀察變數或者屬性,使用watchpoint set variable命令即可。watchpoint set variable傳入的是變數名。需要註意的是,這裡不接受方法,所以不能使用watchpoint set variable self.string,因為self.string調用的是string的getter方法
(lldb) watchpoint set variable self->_string
Watchpoint created: Watchpoint 1: addr = 0x7fcf3959c418 size = 8 state = enabled type = w
    watchpoint spec = 'self->_string'
    new value: 0x0000000000000000
-
watchpoint set expression:如果我們想直接觀察某個地址,可以使用watchpoint set expression
//我們先拿到_model的地址,然後對地址設置一個watchpoint
(lldb) p &_model
(Modek **) $3 = 0x00007fe0dbf23280
(lldb) watchpoint set expression 0x00007fe0dbf23280
Watchpoint created: Watchpoint 1: addr = 0x7fe0dbf23280 size = 8 state = enabled type = w
    new value: 0
-
watchpoint command add:和breakpoint一樣,給watchpoint添加命令
//設置一個watchpoint
(lldb) watchpoint set variable _string
Watchpoint created: Watchpoint 1: addr = 0x7fe4e1444760 size = 8 state = enabled type = w
    watchpoint spec = '_string'
    new value: 0x0000000000000000

//可以看到這個watchpoint的id是1。我們可以用watchpoint command add -o添加單條命令
watchpoint command add -o 'bt' 1

//我們也可以一次添加多條命令
(lldb) watchpoint command add 1
Enter your debugger command(s).  Type 'DONE' to end.
> bt
> continue
> DONE
-
watchpoint command list:列出某個watchpoint所有的command
-
watchpoint command delete:刪除某個watchpoint所有的command
-
watchpoint list:查看當前所有watchpoint
-
watchpoint disable/enable:使某個watchpoint失效/生效
-
watchpoint delete:刪除watchpoint,刪除單個或多個,用法同breakpoint delete