
關於Prometheus Prometheus是一套開源的監控系統,它將所有信息都存儲為時間序列數據;因此實現一種Profiling監控方式,實時分析系統運行的狀態、執行時間、調用次數等,以找到系統的熱點,為性能優化提供依據。 監控方式 程式代碼收集運行數據寫入到redis,通過API介面開放給Pr ...
關於Prometheus
Prometheus是一套開源的監控系統,它將所有信息都存儲為時間序列數據;因此實現一種Profiling監控方式,實時分析系統運行的狀態、執行時間、調用次數等,以找到系統的熱點,為性能優化提供依據。 監控方式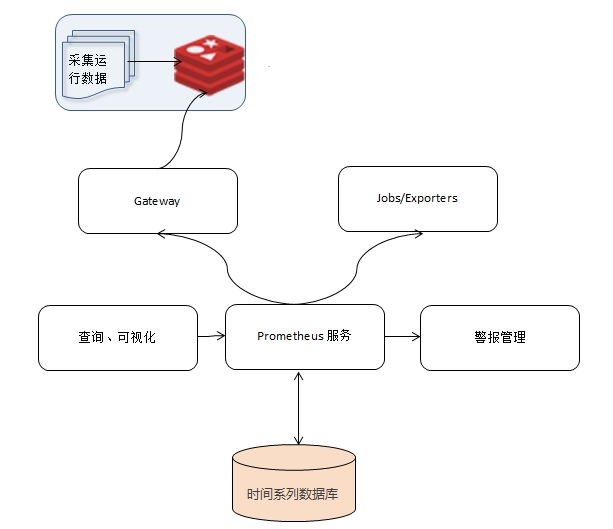 程式代碼收集運行數據寫入到redis,通過API介面開放給Prometheus,Prometheus定時去抓取介面上的數據,形成時間繫數據存入到本地。同時通過promql與開放介面可視化數據到前端。
一、採集運行數據寫入到redis
在採集數據之前,先要明白Prometheus所支持的幾種數據類型
Counter,統計類數據
Counter作為一種計數類數據類型,常用於介面調用次數、請求總數、當前線上人數等等
Gauge,記錄對象或許事物的瞬時值
Gauge是最簡單的度量類型,只有一個簡單的返回值,他用來記錄一些對象或者事物的瞬時值,如CPU使用率、記憶體使用情況、磁碟空間等。
Histograms,直方圖
Histrogram是用來度量數據中值的分佈情況,如程式執行時間:0-100ms、100-200ms、200-300ms、>300ms 的分佈情況
在使用Prometheus監控之前,先要明白都需要監控哪些項,以及每一中項都應該採用什麼數據類型來表示
明白以上類型之後,就可以開始將監控數據項寫入到redis。寫入的工具可採用開源的prometheus_client_php;github:https://github.com/Jimdo/prometheus_client_php
下載後需要用composer部署其依賴,如果你不知道composer的使用:http://www.phpcomposer.com
以下代碼記錄一個counter數據
程式代碼收集運行數據寫入到redis,通過API介面開放給Prometheus,Prometheus定時去抓取介面上的數據,形成時間繫數據存入到本地。同時通過promql與開放介面可視化數據到前端。
一、採集運行數據寫入到redis
在採集數據之前,先要明白Prometheus所支持的幾種數據類型
Counter,統計類數據
Counter作為一種計數類數據類型,常用於介面調用次數、請求總數、當前線上人數等等
Gauge,記錄對象或許事物的瞬時值
Gauge是最簡單的度量類型,只有一個簡單的返回值,他用來記錄一些對象或者事物的瞬時值,如CPU使用率、記憶體使用情況、磁碟空間等。
Histograms,直方圖
Histrogram是用來度量數據中值的分佈情況,如程式執行時間:0-100ms、100-200ms、200-300ms、>300ms 的分佈情況
在使用Prometheus監控之前,先要明白都需要監控哪些項,以及每一中項都應該採用什麼數據類型來表示
明白以上類型之後,就可以開始將監控數據項寫入到redis。寫入的工具可採用開源的prometheus_client_php;github:https://github.com/Jimdo/prometheus_client_php
下載後需要用composer部署其依賴,如果你不知道composer的使用:http://www.phpcomposer.com
以下代碼記錄一個counter數據
require __DIR__ . '/../vendor/autoload.php';
use Prometheus\CollectorRegistry;
use Prometheus\Storage\Redis;

Redis::setDefaultOptions(array('host' => 'master.redis.reg'));
$adapter = new Prometheus\Storage\Redis();
$registry = new CollectorRegistry($adapter);

$counter = $registry->registerCounter('test', 'some_counter', 'it increases', ['type']);
$counter->incBy(1, ['blue']);  //將統計結果增加1
採集的過程比較簡單,Gauge與Histograms與此類似 二、提供Prometheus訪問的API Gateway prometheus_client_php工具已經準好了prometheus訪問的相關介面,我們至需要幾行簡單的代碼
require __DIR__ . '/../vendor/autoload.php';

use Prometheus\CollectorRegistry;
use Prometheus\RenderTextFormat;
use Prometheus\Storage\Redis;

Redis::setDefaultOptions(array('host' => 'master.redis.reg')); //對應寫入的redis
$adapter = new Prometheus\Storage\Redis();
$registry = new CollectorRegistry($adapter);
$renderer = new RenderTextFormat();
$result = $renderer->render($registry->getMetricFamilySamples());

header('Content-type: ' . RenderTextFormat::MIME_TYPE);
echo $result; //輸出結果給prometheus服務
將以上腳本部署,能通過HTTP訪問到,下一步即可提供給prometheus服務 三、安裝與配置Prometheus 安裝(略過) 配置Prometheus 打開prometheus.yml文件,在scrape_configs配置第二步中的API Gateway
 - job_name: 'prometheus2'
    metrics_path: '/metrics.php'
    static_configs:
      - targets: ['localhost:9999']
配置完成後,啟動Prometheus 四、查看監控數據 Prometheus具有多種模式的可視化數據,可集成Grafana可視化工具。其內置PromDash界面,啟動後打開http://localhost:9090(預設9090埠)即可訪問內置的PromDash監控界面。
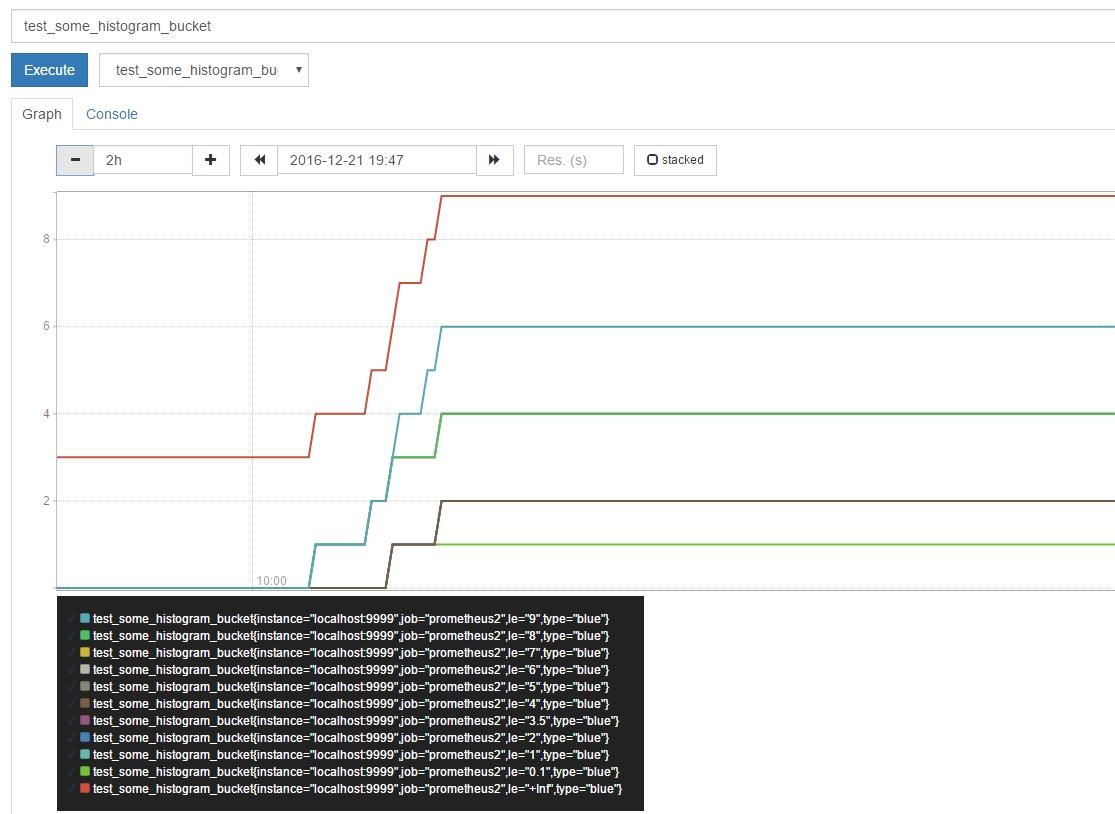 上圖是Prometheus的直方圖展現形式,頂部的下拉框是你所監控的數據項,點擊Execute點擊後查看所監控的數據。輸入框部分是是查詢的表達式,Prometheus支持豐富的查詢表達式,詳情參閱:https://prometheus.io/docs/querying/basics/ 。
圖中的每一條線表示大於該桶的數據,紅色的數據線是所有桶的總數累計。另外Prometheus還提供了sum與cont的統計。Gauge與Counter數據類型也與此類似。
上圖是Prometheus的直方圖展現形式,頂部的下拉框是你所監控的數據項,點擊Execute點擊後查看所監控的數據。輸入框部分是是查詢的表達式,Prometheus支持豐富的查詢表達式,詳情參閱:https://prometheus.io/docs/querying/basics/ 。
圖中的每一條線表示大於該桶的數據,紅色的數據線是所有桶的總數累計。另外Prometheus還提供了sum與cont的統計。Gauge與Counter數據類型也與此類似。