
實例項目使用 vite5 + vue3 + ts,項目地址 vite-vue3-charts,預覽地址 https://weizwz.com/vite-vue3-charts 準備工作 1. 註冊為百度地圖開發者 官網地址,然後在 應用管理 -> 我的應用 里,創建應用,創建好後複製 AK 2. 在 ...
實例項目使用 vite5 + vue3 + ts,項目地址 vite-vue3-charts,預覽地址 https://weizwz.com/vite-vue3-charts
準備工作
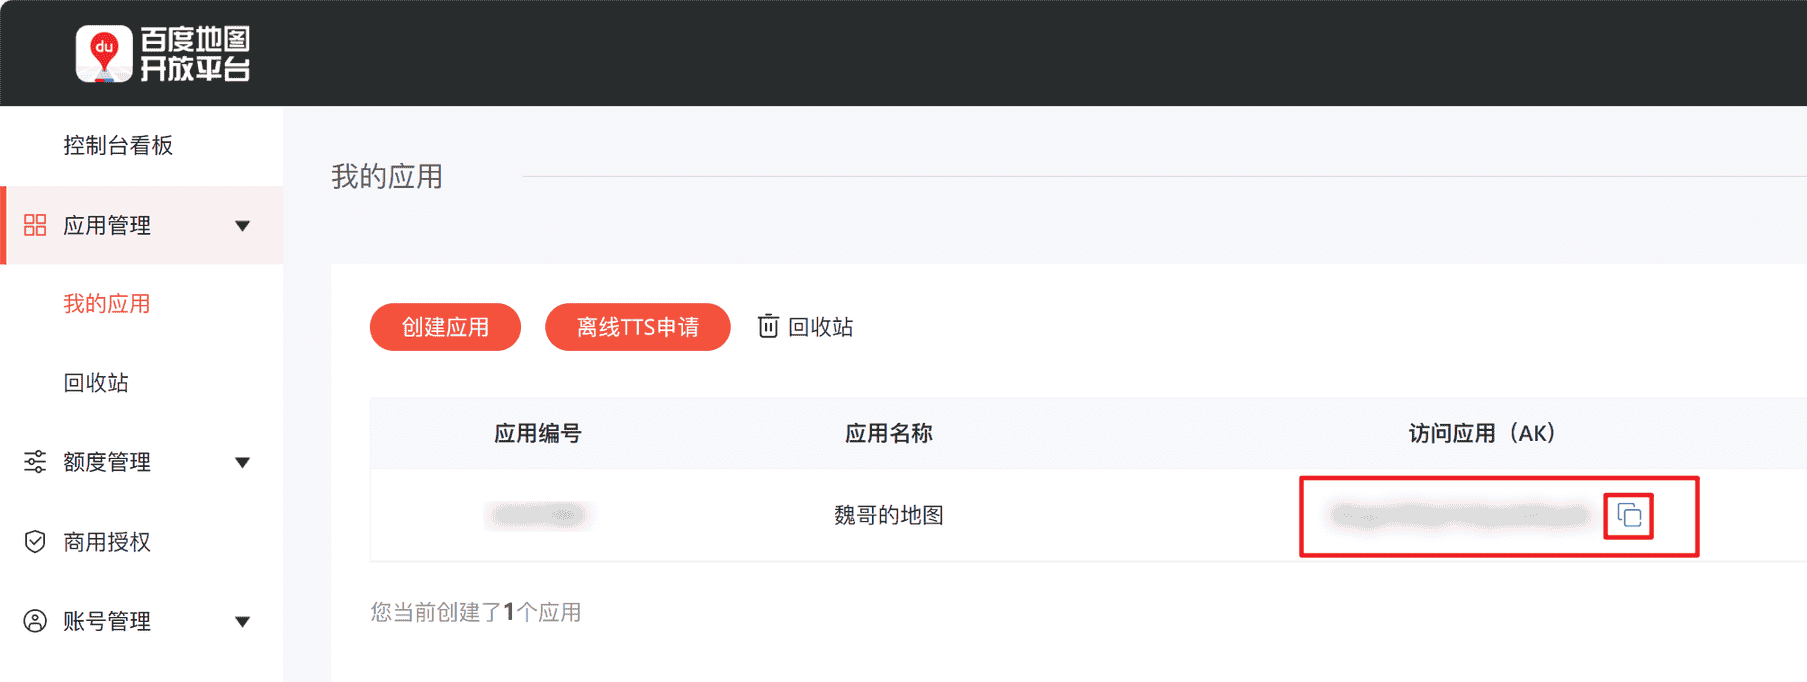
1. 註冊為百度地圖開發者
官網地址,然後在 應用管理 -> 我的應用 里,創建應用,創建好後複製 AK
2. 在根目錄的 index.html 里引入百度地圖
<head>
  <meta charset="UTF-8" />
  <link rel="icon" type="image/svg+xml" href="/vite.svg" />
  <meta name="viewport" content="width=device-width, initial-scale=1.0" />
  <title>xxx</title>
  <script type="text/javascript" src="https://api.map.baidu.com/api?v=3.0&ak=你複製好的AK"></script>
</head>
在 head 里引入,是為了提前載入進來
3. 安裝 echarts
npm i echarts -S
封裝
1. 增加ts對百度地圖的支持
修改 .eslintrc.cjs,加入對百度地圖的支持
module.exports = {
  // 其他省略
  globals: {
    BMap: true
  }
}
2. 全局註冊 echarts
修改 main.ts
// 引入 echarts
import * as echarts from 'echarts'
import themeJSON from '@/assets/weizwz.json'
echarts.registerTheme('weizwz', themeJSON)

const app = createApp(App)
// 全局掛載 echarts
app.config.globalProperties.$echarts = echarts
3. 封裝 echarts
src/components 下新建 chart 文件夾,併在其下新建 index.vue,封裝如下
<script setup lang="ts">
import { onMounted, getCurrentInstance, defineExpose, ref } from 'vue'

defineOptions({
  name: 'WChart'
})
// defineExpose 讓父組件可調用此方法
defineExpose({
  setData
})

// 組件傳參
const props = defineProps({
  width: {
    type: String, //參數類型
    default: '100%', //預設值
    required: false //是否必須傳遞
  },
  height: {
    type: String,
    default: '10rem',
    required: true
  },
  option: {
    type: Object,
    default: () => {
      return {}
    },
    required: true
  },
  // 初始化之前的工作,比如載入百度地圖相關數據
  initBefore: {
    type: Function,
    required: false
  },
  // 初始化之後的工作,比如添加百度地址控制項
  initAfter: {
    type: Function,
    required: false
  }
})

let chart: { setOption: (arg0: Record<string, any>) => void; resize: () => void }
const wchart = ref(null)

//聲明周期函數,自動執行初始化
onMounted(() => {
  init()
  // 監控視窗大小,自動適應界面
  window.addEventListener('resize', resize, false)
})

//初始化函數
function init() {
  // 基於準備好的dom,初始化echarts實例
  const dom = wchart.value
  // 通過 internalInstance.appContext.config.globalProperties 獲取全局屬性或方法
  let internalInstance = getCurrentInstance()
  let echarts = internalInstance?.appContext.config.globalProperties.$echarts

  chart = echarts.init(dom, 'weizwz')
  // 渲染圖表
  if (props.initBefore) {
    props.initBefore(chart).then((data: Record<string, any>) => {
      setData(data)
      if (props.initAfter) props.initAfter(chart)
    })
  } else {
    chart.setOption(props.option)
    if (props.initAfter) props.initAfter(chart)
  }
}

function resize() {
  chart.resize()
}
// 父組件可調用,設置動態數據
function setData(option: Record<string, any>) {
  chart.setOption(option)
}
</script>

<template>
  <div ref="wchart" :style="`width: ${props.width} ; height: ${props.height}`" />
</template>

<style lang="scss" scoped></style>
使用
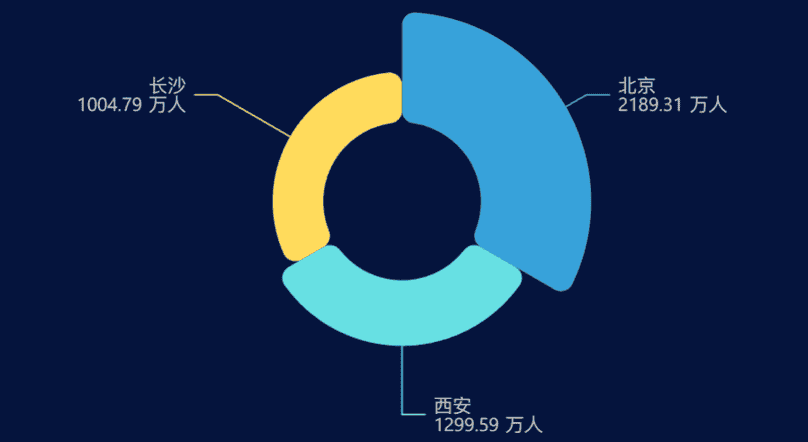
1. 使用 echarts 普通圖表
示例:使用玫瑰環形圖
<script setup lang="ts">
import WChart from '@comp/chart/index.vue'

defineOptions({
  name: 'ChartLoop'
})
// 正常 echarts 參數
const option = {
  grid: {
    top: '20',
    left: '10',
    right: '10',
    bottom: '20',
    containLabel: true
  },
  series: [
    {
      name: '人口統計',
      type: 'pie',
      radius: [50, 120],
      center: ['50%', '50%'],
      roseType: 'area',
      itemStyle: {
        borderRadius: 8
      },
      label: {
        formatter: '{b}\n{c} 萬人'
      },
      data: [
        { value: 2189.31, name: '北京' },
        { value: 1299.59, name: '西安' },
        { value: 1004.79, name: '長沙' }
      ]
    }
  ]
}
</script>

<template>
  <WChart width="100%" height="300px" :option="option" />
</template>

<style lang="scss" scoped></style>
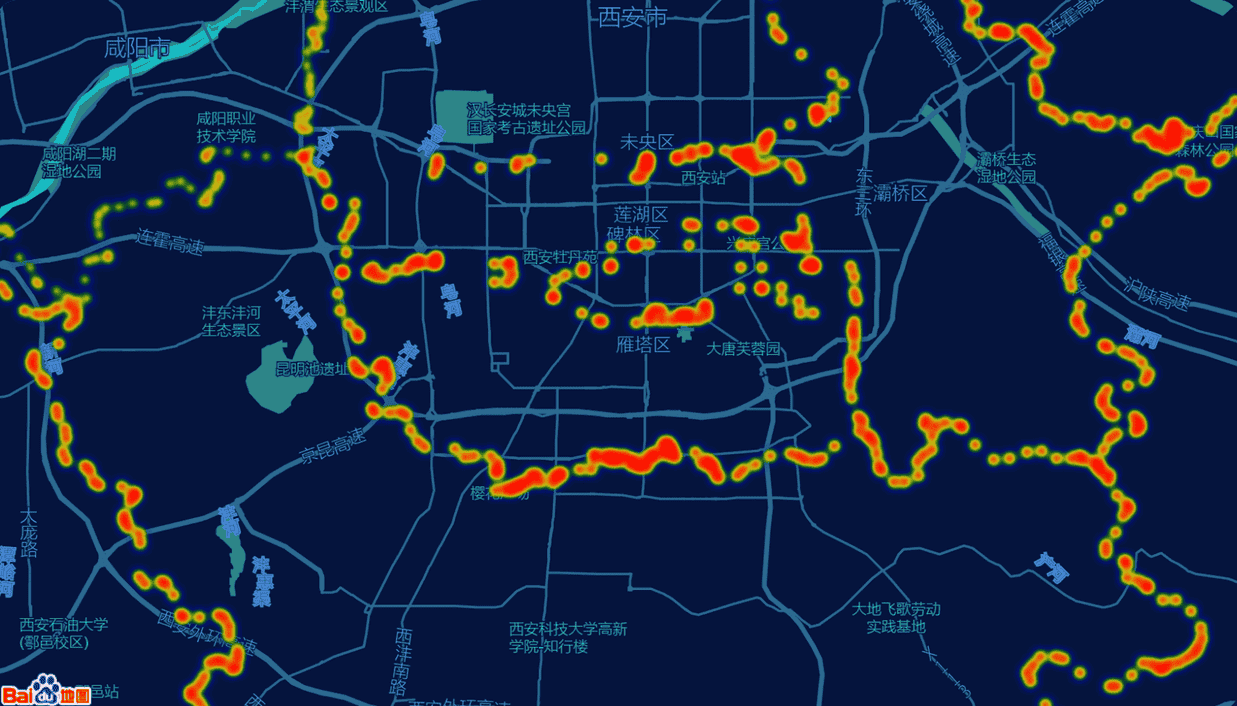
2. 結合百度地圖
示例:西安熱力圖
<script setup lang="ts">
import { reactive } from 'vue'
import WChart from '@comp/chart/index.vue'
// 註意需要引入 bmap,即 echarts 對百度地圖的支持擴展
import 'echarts/extension/bmap/bmap'
// 熱力數據,內容如:{ features: [ { geometry: { coordinates: [ [ [x, y] ] ] } } ]}
// 為什麼這麼複雜,因為是我從阿裡地理數據下載的,地址 https://datav.aliyun.com/portal/school/atlas/area_selector
import xianJson from '@/assets/xian.json'

defineOptions({
  name: 'ChartMap'
})

const option = {
  animation: false,
  backgroundColor: 'transparent',
  bmap: {
    // 地圖中心點
    center: [108.93957150268, 34.21690396762],
    zoom: 12,
    roam: true
  },
  visualMap: {
    show: false,
    top: 'top',
    min: 0,
    max: 5,
    seriesIndex: 0,
    calculable: true,
    inRange: {
      color: ['blue', 'blue', 'green', 'yellow', 'red']
    }
  },
  series: [
    {
      type: 'heatmap',
      coordinateSystem: 'bmap',
      data: reactive([] as any[]),
      pointSize: 5,
      blurSize: 6
    }
  ]
}

const initBefore = () => {
  return new Promise((resolve) => {
    // 處理數據
    const arr = []
    for (const item of xianJson.features) {
      const positions = item.geometry.coordinates[0][0]
      for (const temp of positions) {
        const position = temp.concat(Math.random() * 1000 + 200)
        arr.push(position)
      }
    }
    option.series[0].data = arr
    resolve(option)
  })
}

const initAfter = (chart: {
  getModel: () => {
    (): any
    new (): any
    getComponent: { (arg0: string): { (): any; new (): any; getBMap: { (): any; new (): any } }; new (): any }
  }
}) => {
  // 添加百度地圖插件
  var bmap = chart.getModel().getComponent('bmap').getBMap()
  // 百度地圖樣式,需要自己去創建
  bmap.setMapStyleV2({
    styleId: 'bc05830a75e51be40a38ffc9220613bb'
  })
  // bmap.addControl(new BMap.MapTypeControl())
}
</script>

<template>
  <WChart width="100%" height="500px" :option="option" :initBefore="initBefore" :initAfter="initAfter" />
</template>

<style lang="scss" scoped></style>
https://www.cnblogs.com/weizwz/p/17933635.html
本博客所有文章除特別聲明外,均採用 「CC BY-NC-SA 4.0 DEED」 國際許可協議,轉載請註明出處!
內容粗淺,如有錯誤,歡迎大佬批評指正