一、要實現的效果(縱向固定表頭的表格,橫向表頭數量動態化) 二、這是後臺返回的數據格式(以企業為數組,每個企業里有個站點數組pointFactors) 三、代碼實現步驟 (1)定義縱向固定表頭 1 // 縱向表頭數組 tableColumns 2 const tableColumns = ref([ ...
一、要實現的效果(縱向固定表頭的表格,橫向表頭數量動態化)

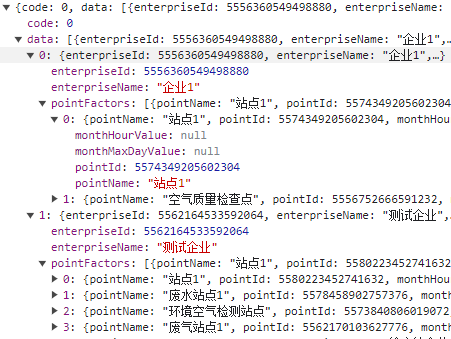
二、這是後臺返回的數據格式(以企業為數組,每個企業里有個站點數組pointFactors)

三、代碼實現步驟
(1)定義縱向固定表頭
 1 // 縱向表頭數組 tableColumns
 2 const tableColumns = ref([
 3   {
 4     label: "日(24小時)數據濃度均值",
 5     value: "monthMaxDayValue",
 6   },
 7   {
 8     label: "小時數據平均濃度均值",
 9     value: "monthHourValue",
10   },
11 ]);
(2)動態生成橫向表頭(從介面獲取數據)
 1 //定義橫向表頭列 columns
 2  const columns = ref([]);
 3 //定義表格數據
 4  const list = ref([]);
 5
 6  // 先添加第一列
 7  columns.value = [
 8       {
 9         title: "",
10         dataIndex: "timeType",
11         width: 190,
12        fixed: "left",
13      },
14   ];
15
16 //處理介面返回的數據data,動態拼接表頭數組 columns
17 data.forEach(item => {
18      const obj = {
19         id: item.enterpriseId,
20         parentId: null,
21         title: item.enterpriseName,
22         align: "center",
23         children: [],
24       };
25       if (item.pointFactors.length) {
26           item.pointFactors.forEach(element => {
27               list.push({
28                 name: element.pointName,
29                 id: element.pointId,
30                 monthMaxDayValue: element.monthMaxDayValue,
31                 monthHourValue: element.monthHourValue,
32               });
33               const childObj = {
34                 id: element.pointId,
35                 parentId: item.enterpriseId,
36                 title: element.pointName,
37                 width: 130,
38                 align: "center",
39                 dataIndex: element.pointId,
40                 customRender: ({ record }) => {
41                   return record[element.pointId]
42                     ? record[element.pointId]
43                     : "-";
44                 },
45               };
46               obj.children.push(childObj);
47           });
48      }
49      columns.value.push(obj);
50 });
(3)迴圈原始數據,生成組件需要的橫向數據
 1 // tableColums  已定義的縱向表頭
 2 // tableData   已定義的表格數組
 3
 4  for (const tab of tableColumns.value) {
 5      const col: any = Object.create(null);
 6
 7      list.forEach((item, index) => {
 8          col.timeType = tab.label;
 9          col[list[index + 0].id] = item[tab.value];
10      });
11      tableData.value.push(col);
12 }
(4)數據帶入表格組件中
 <a-table
     :columns="columns"
     :data-source="tableData"
     :pagination="false"
     row-key="id"
     bordered
 />


