開門見山。 這篇文章,教大家用Python實現常用的假設檢驗! 服從什麼分佈,就用什麼區間估計方式,也就就用什麼檢驗! 比如:兩個樣本方差比服從F分佈,區間估計就採用F分佈計算臨界值(從而得出置信區間),最終採用F檢驗。 建設檢驗的基本步驟: 前言 假設檢驗用到的Python工具包 •Statsmo ...
開門見山。
這篇文章,教大家用Python實現常用的假設檢驗!

服從什麼分佈,就用什麼區間估計方式,也就就用什麼檢驗!
比如:兩個樣本方差比服從F分佈,區間估計就採用F分佈計算臨界值(從而得出置信區間),最終採用F檢驗。


建設檢驗的基本步驟:

前言
假設檢驗用到的Python工具包
•Statsmodels是Python中,用於實現統計建模和計量經濟學的工具包,主要包括描述統計、統計模型估計和統計推斷
•Scipy是一個數學、科學和工程計算Python工具包,主要包括統計,優化,整合,線性代數等等與科學計算有關的包
導入數據
python學習交流Q群:906715085####
from sklearn.datasets import load_iris
import numpy as np
#導入IRIS數據集
iris = load_iris()
iris=pd.DataFrame(iris.data,columns=
['sepal_length','sepal_width','petal_legth','petal_width'])print(iris)
一個總體均值的z檢驗

Python學習交流Q群:906715085###
np.mean(iris['petal_legth'])
'''
原假設:鳶尾花花瓣平均長度是4.2
備擇假設:鳶尾花花瓣平均長度不是4.2
'''
import statsmodels.stats.weightstats
z, pval =
statsmodels.stats.weightstats.ztest(iris
['petal_legth'], value=4.2)
print(z,pval)

'''
P=0.002 <5%, 拒絕原假設,接受備則假設。
'''
一個總體均值的t檢驗

import scipy.stats
t, pval = scipy.stats.ttest_1samp(iris
['petal_legth'], popmean=4.0)print(t, pval)
'''
P=0.0959 > 5%, 接受原假設,即花瓣長度為4.0。
 '''
模擬雙樣本t檢驗
#取兩個樣本
iris_1 = iris[iris.petal_legth >= 2]
iris_2 = iris[iris.petal_legth < 2]
print(np.mean(iris_1['petal_legth']))
print(np.mean(iris_2['petal_legth']))
'''
H0: 兩種鳶尾花花瓣長度一樣
H1: 兩種鳶尾花花瓣長度不一樣
'''

import scipy.stats
t, pval = scipy.stats.ttest_ind(iris_1
['petal_legth'],iris_2['petal_legth'])
print(t,pval)
'''
p<0.05,拒絕H0,認為兩種鳶尾花花瓣長度不一樣
'''

練習
數據欄位說明:
•gender:性別,1為男性,2為女性
•Temperature:體溫
•HeartRate:心率
•共130行,3列
•用到的數據鏈接:pan.baidu.com/s/1t4SKF6
本周需要解決的幾個小問題:
-
人體體溫的總體均值是否為98.6華氏度?
-
人體的溫度是否服從正態分佈?
-
人體體溫中存在的異常數據是哪些?
-
男女體溫是否存在明顯差異?
-
體溫與心率間的相關性(強?弱?中等?)
1.1 探索數據
import numpy as np
import pandas as pd
from scipy import stats
data = pd.read_csv
("C:\\Users\\baihua\\Desktop\\test.csv")
print(data.head())
sample_size = data.size #130*3
out:
Temperature  Gender  HeartRate
0         96.3       1         70
1         96.7       1         71
2         96.9       1         74
3         97.0       1         80
4         97.1       1         73
print(data.describe())
out:
Temperature
Gender   HeartRatecount   130.000000  130.000000  130.000000
mean     98.249231    1.500000   73.761538
std       0.733183    0.501934    7.062077
min      96.300000    1.000000   57.000000
25%      97.800000    1.000000   69.000000
50%      98.300000    1.500000   74.000000
75%      98.700000    2.000000   79.000000
max     100.800000    2.000000   89.000000
人體體溫均值是98.249231
1.2 人體的溫度是否服從正態分佈?
'''
人體的溫度是否服從正態分佈?
先畫出分佈的直方圖,然後使用scipy.stat.kstest
函數進行判斷。

'''
%matplotlib inline
import seaborn as
snssns.distplot(data['Temperature'],
color='b', bins=10, kde=True)

stats.kstest(data['Temperature'], 'norm')
out:
KstestResult(statistic=1.0, pvalue=0.0)
'''
p<0.05,不符合正態分佈
'''
判斷是否服從t分佈

'''判斷是否服從t分佈:
'''
np.random.seed(1)
ks = stats.t.fit(data['Temperature'])
df = ks[0]
loc = ks[1]
scale = ks[2]
t_estm = stats.t.rvs(df=df, loc=loc,
scale=scale, size=sample_size)
stats.ks_2samp(data['Temperature'],
t_estm)

'''
 pvalue=0.4321464176976891 <0.05,認為體溫服從t分佈
 '''
判斷是否服從卡方分佈

'''
判斷是否服從卡方分佈:

'''np.random.seed(1)
chi_square = stats.chi2.fit(data
['Temperature'])
df = chi_square[0]
loc = chi_square[1]
scale = chi_square[2]
chi_estm = stats.chi2.rvs(df=df, loc=loc,
scale=scale, size=sample_size)
stats.ks_2samp(data['Temperature'],
 chi_estm)
'''
pvalue=0.3956146564478842>0.05,認為體溫服從卡方分佈
'''
繪製卡方分佈直方圖
'''
繪製卡方分佈圖

'''
from matplotlib import pyplot as plt
plt.figure()
data['Temperature'].plot(kind = 'kde')
chi2_distribution = stats.chi2(chi_square
[0], chi_square[1],chi_square[2])
x = np.linspace(chi2_distribution.ppf
(0.01), chi2_distribution.ppf(0.99), 100)
plt.plot(x, chi2_distribution.pdf(x),
 c='orange')
 plt.xlabel('Human temperature')
 plt.title('temperature on chi_square',
  size=20)
 plt.legend(['test_data', 'chi_square'])

1.3 人體體溫中存在的異常數據是哪些?
'''
已知體溫數據服從卡方分佈的情況下,可以直接使用
Python計算出P=0.025和P=0.925時(該函數使用單側概率值)的分佈值,在分佈值兩側的數據屬於小概率,認為是異常值。
'''
lower1=chi2_distribution.ppf(0.025)
lower2=chi2_distribution.ppf(0.925)
t=data['Temperature']
print(t[t<lower1] )
print(t[t>lower2])

out:
0     96.3
1     96.7
65    96.4
66    96.7
67    96.8
Name: Temperature, dtype: float64
63      99.4
64      99.5
126     99.4
127     99.9
128    100.0
129    100.8
Name: Temperature, dtype: float64
1.4 男女體溫差異是否顯著
'''
此題是一道兩個總體均值之差的假設檢驗問題,因為是否存在差別並不涉及方向,所以是雙側檢驗。建立原假設和備擇假設如下:
H0:u1-u2 =0  沒有顯著差
H1:u1-u2 != 0  有顯著差別

'''
data.groupby(['Gender']).size() #樣本量65
male_df = data.loc[data['Gender'] == 1]
female_df = data.loc[data['Gender'] == 2]

'''
使用Python自帶的函數,P用的雙側累計概率
'''

import scipy.stats
t, pval = scipy.stats.ttest_ind(male_df
['Temperature'],female_df['Temperature'])
print(t,pval)if pval > 0.05:
print('不能拒絕原假設,男女體溫無明顯差異。')
else:
print('拒絕原假設,男女體溫存在明顯差異。')
out:
-2.2854345381654984 0.02393188312240236拒絕原假設,男女體溫存在明顯差異。

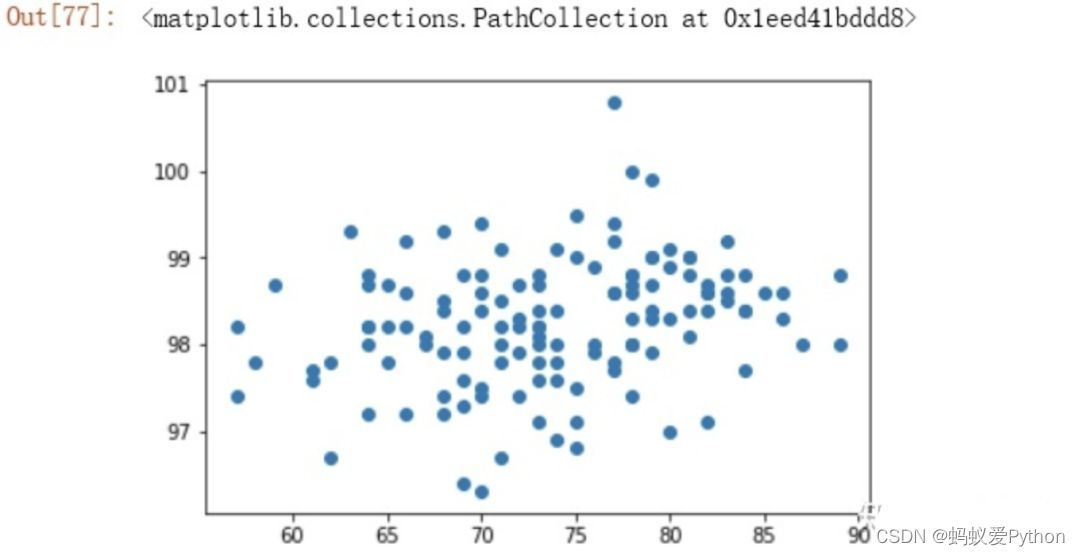
1.5 體溫與心率間的相關性(強?弱?中等?)
'''
體溫與心率間的相關性(強?弱?中等?)
'''
heartrate_s = data['HeartRate']
temperature_s = data['Temperature']
from matplotlib import pyplot as plt
plt.scatter(heartrate_s, temperature_s)

stat, p = stats.pearsonr(heartrate_s,
 temperature_s)
 print('stat=%.3f, p=%.3f' % (stat, p))
 print(stats.pearsonr(heartrate_s,
  temperature_s))
'''
相關係數為0.004,可以認為二者之間沒有相關性
'''
最後,今天給大家分享的這篇文章到這裡就結束了,喜歡的小伙伴記得點贊收藏,有問題的小伙伴記得及時提出來解決問題,下一篇文章見了。


