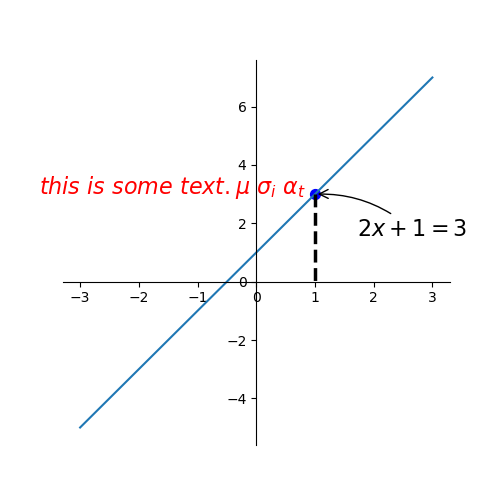
import numpy from matplotlib import pyplot x=numpy.linspace(-3,3,50) y=2*x+1 pyplot.figure(num=1,figsize=(5,5)) pyplot.plot(x,y) ax=pyplot.gca() ax.sp ...
import  numpy
from  matplotlib  import  pyplot
x=numpy.linspace(-3,3,50)
y=2*x+1

pyplot.figure(num=1,figsize=(5,5))
pyplot.plot(x,y)


ax=pyplot.gca()
ax.spines['right'].set_color('none')
ax.spines['top'].set_color('none')
ax.xaxis.set_ticks_position('bottom')
ax.spines['bottom'].set_position(('data',0))
ax.yaxis.set_ticks_position('left')
ax.spines['left'].set_position(('data',0))


x0=1
y0=2*x0+1
pyplot.scatter(x0,y0,s=50,color='b')   #在直線上顯示一個點,s指點的面積大小,color指點的顏色
pyplot.plot([x0,x0],[y0,0],'k--',lw=2.5)

#方法一
pyplot.annotate(r'$2x+1=%s$'%y0,xy=(x0,y0),xycoords='data',xytext=(+30,-30),textcoords='offset points',fontsize=16,arrowprops=dict(arrowstyle='->',connectionstyle='arc3,rad=.2'))

#方法二
pyplot.text(-3.7,3,r'$this\ is\ some\ text. \mu\ \sigma_i\ \alpha_t$',fontdict={'size':16,'color':'r'})


pyplot.show()


