本篇博客新開一個數據分析後的數據可視化的例子講解,每一篇博客是一個例子。 這節課學習如何繪製一個折線圖。題目如下: 代碼如下: 效果如下: ...
本篇博客新開一個數據分析後的數據可視化的例子講解,每一篇博客是一個例子。
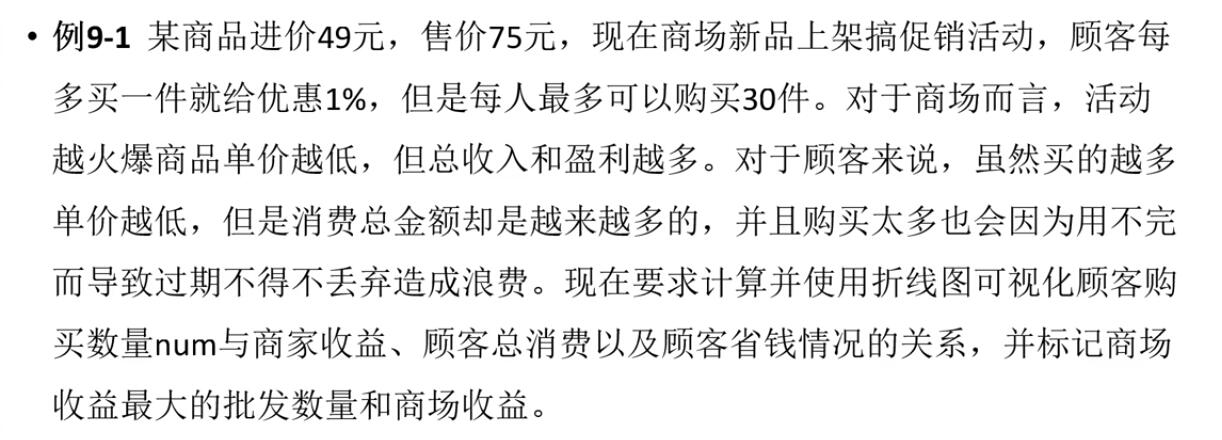
這節課學習如何繪製一個折線圖。題目如下:

代碼如下:
import matplotlib.pyplot as plt
import matplotlib.font_manager as fm 	# 用於設置中文字體

# 進價與零售價
basePrice, salePrice = 49, 75

# 計算購買num個商品時的單價,買的越多,單價越低
def compute(num):
    return salePrice * (1-0.01*num)

# numbers用來存儲顧客購買數量
# earns用來存儲商場的盈利情況
# totalConsumption用來存儲顧客消費總金額
# saves用來存儲顧客節省的總金額
numbers = list(range(1, 31))
earns = []
totalConsumption = []
saves = []
# 根據顧客購買數量計算三組數據
for num in numbers:
    perPrice = compute(num)
    earns.append(round(num*(perPrice-basePrice), 2))
    totalConsumption.append(round(num*perPrice, 2))
    saves.append(round(num*(salePrice-perPrice), 2))

# 繪製商家盈利和顧客節省的折線圖,系統自動分配線條顏色
plt.plot(numbers, earns, label='商家盈利')
plt.plot(numbers, totalConsumption, label='顧客總消費')
plt.plot(numbers, saves, label='顧客節省')

# 設置坐標軸標簽文本
plt.xlabel('顧客購買數量(件)', fontproperties='simhei')
plt.ylabel('金額(元)', fontproperties='simhei')
# 設置圖形標題
plt.title('num-money charts', fontproperties='stkaiti', fontsize=20)

# 創建字體,設置圖例
myfont = fm.FontProperties(fname=r'C:\\Windows\\Fonts\\STKAITIl.ttf',
                           size=12)

plt.legend(prop=myfont)

# 計算並標記商家盈利最多的批發數量
maxEarn = max(earns)
bestNumber = numbers[earns.index(maxEarn)]
# 散點圖,在相應位置繪製一個紅色五角星,詳見9.3節
plt.scatter([bestNumber], [maxEarn], marker='*', color='red', s=120)
# 使用annotate()函數在指定位置進行文本標註
plt.annotate(xy=(bestNumber, maxEarn),          # 箭頭終點坐標
             xytext=(bestNumber-1, maxEarn+200),# 箭頭起點坐標
             s=str(maxEarn),                    # 顯示的標註文本
             arrowprops=dict(arrowstyle="->"))  # 箭頭樣式

# 顯示圖形
plt.show()
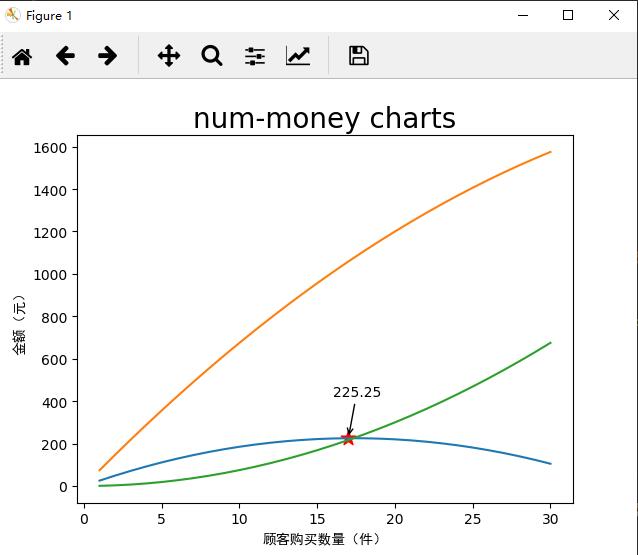
效果如下:


