
自定義雷達圖表如下: 1、創建UserControl,名為“RadarChartControl” 前臺: <UserControl x:Class="WpfApplication2.RadarChartControl" xmlns="http://schemas.microsoft.com/winf ...
自定義雷達圖表如下:
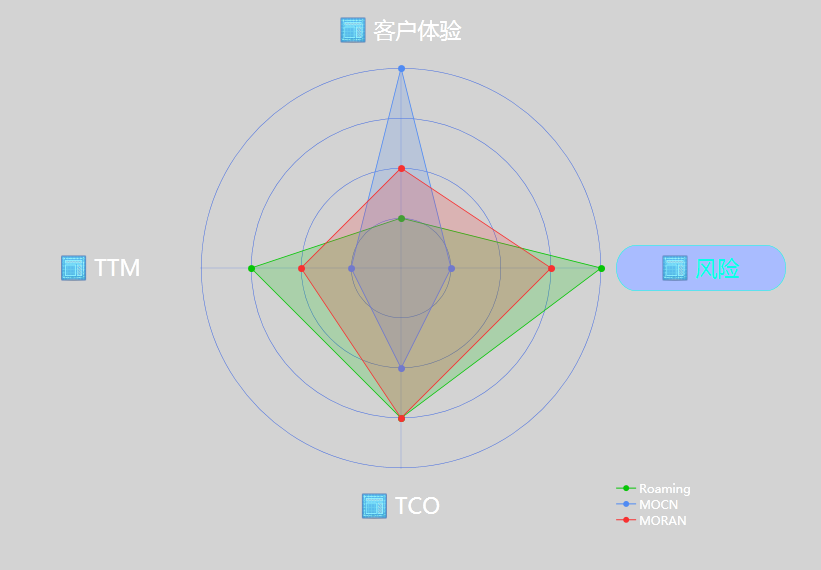

1、創建UserControl,名為“RadarChartControl”
前臺:


<UserControl x:Class="WpfApplication2.RadarChartControl"
            xmlns="http://schemas.microsoft.com/winfx/2006/xaml/presentation"
            xmlns:x="http://schemas.microsoft.com/winfx/2006/xaml"
            xmlns:mc="http://schemas.openxmlformats.org/markup-compatibility/2006"
            xmlns:d="http://schemas.microsoft.com/expression/blend/2008"
            mc:Ignorable="d"
            d:DesignHeight="300" d:DesignWidth="300" Loaded="RadarChartControl_OnLoaded">
    <Canvas x:Name="CanvasPanel" HorizontalAlignment="Center" VerticalAlignment="Center">
    </Canvas>
</UserControl>
View Code
後臺:
/// <summary>
    /// RadarChartControl.xaml 的交互邏輯
    /// </summary>
    public partial class RadarChartControl : UserControl
    {
        public RadarChartControl()
        {
            InitializeComponent();
        }
        #region 屬性
        /// <summary>
        /// 尺寸大小
        /// 高寬大小一樣
        /// </summary>
        public double Size
        {
            get { return (double)GetValue(SizeProperty); }
            set { SetValue(SizeProperty, value); }
        }

        public static readonly DependencyProperty SizeProperty = DependencyProperty.Register("Size", typeof(double),
        typeof(RadarChartControl), new PropertyMetadata(400.0));
        /// <summary>
        /// 標題
        /// </summary>
        public List<ArgumentModel> Arguments
        {
            get { return (List<ArgumentModel>)GetValue(ArgumentsProperty); }
            set { SetValue(ArgumentsProperty, value); }
        }

        public static readonly DependencyProperty ArgumentsProperty = DependencyProperty.Register("Arguments", typeof(List<ArgumentModel>),
        typeof(RadarChartControl), new PropertyMetadata(new List<ArgumentModel>()));
        /// <summary>
        /// 數據
        /// </summary>
        public List<ChartItem> Datas
        {
            get { return (List<ChartItem>)GetValue(DatasProperty); }
            set { SetValue(DatasProperty, value); }
        }

        public static readonly DependencyProperty DatasProperty = DependencyProperty.Register("Datas", typeof(List<ChartItem>),
        typeof(RadarChartControl), new PropertyMetadata(new List<ChartItem>()));
        /// <summary>
        /// 獲取或設置線條顏色
        /// </summary>
        public Brush BorderBrush
        {
            get { return (Brush)GetValue(BorderBrushProperty); }
            set { SetValue(BorderBrushProperty, value); }
        }

        public static readonly DependencyProperty BorderBrushProperty = DependencyProperty.Register("BorderBrush", typeof(Brush),
        typeof(RadarChartControl), new PropertyMetadata(Brushes.RoyalBlue));
        /// <summary>
        /// 連接點大小
        /// </summary>
        public int EllipseSize = 7;
        /// <summary>
        /// 控制項大小
        /// </summary>
        public double TotalSize
        {
            get
            {
                double size = Size + 200;
                return size;
            }
        }
        /// <summary>
        /// 面板
        /// </summary>
        public Canvas ChartCanvas = new Canvas();

        //聲明和註冊路由事件
        public static readonly RoutedEvent TitleClickRoutedEvent =
        EventManager.RegisterRoutedEvent("TitleClick", RoutingStrategy.Bubble, typeof(EventHandler<RoutedEventArgs>), typeof(RadarChartControl));
        //CLR事件包裝
        public event RoutedEventHandler TitleClick
        {
            add { this.AddHandler(TitleClickRoutedEvent, value); }
            remove { this.RemoveHandler(TitleClickRoutedEvent, value); }
        }
        //激發路由事件,借用Click事件的激發方法
        protected void OnClick(object sender, RoutedEventArgs e)
        {
            RoutedEventArgs args = new RoutedEventArgs(TitleClickRoutedEvent, e);
            this.RaiseEvent(args);
        }
        #endregion

        private void RadarChartControl_OnLoaded(object sender, RoutedEventArgs e)
        {
            if (!CheckData())
            {
                throw new Exception("RadarChart的數據之間不匹配!請重新配置!");
            }
            //獲取最大數值
            int maxData = Datas.Max(i => i.DataList.Max(o => o.Data));
            //設置面板和背景
            SetCanvasAndBackground(maxData);
            //設置數據標題
            SetDataTitle(Datas);
            //獲取半圈大小
            double length = Size / 2 / maxData;
            //連接點半徑
            int ellipseR = EllipseSize / 2;
            foreach (var chartItem in Datas)
            {
                var color = chartItem.Color;

                //倆個多邊形,一個設置背景,一個設置邊框
                Polygon polygonArea = new Polygon() { Fill = color, Opacity = 0.2, StrokeThickness = 0 };
                Polygon polygonBorder = new Polygon() { Fill = Brushes.Transparent, Stroke = color, StrokeThickness = 0.8 };

                int index = 0;
                foreach (var data in chartItem.DataList)
                {
                    double currentAngle = Angle * index + 90;
                    double angle = (currentAngle / 360) * 2 * Math.PI;
                    var r = data.Data * length;
                    double x = Size / 2 + r * Math.Cos(angle);
                    double y = Size / 2 - r * Math.Sin(angle);
                    //多邊形添加節點
                    var point = new Point()
                    {
                        X = x,
                        Y = y
                    };
                    polygonArea.Points.Add(point);
                    polygonBorder.Points.Add(point);
                    //設置節點Style
                    var ellipse = new Ellipse() { Width = EllipseSize, Height = EllipseSize, Fill = color };
                    Canvas.SetLeft(ellipse, x - ellipseR);
                    Canvas.SetTop(ellipse, y - ellipseR);
                    ChartCanvas.Children.Add(ellipse);

                    index++;
                }
                ChartCanvas.Children.Add(polygonArea);
                ChartCanvas.Children.Add(polygonBorder);
            }
            //設置標題
            SetArguments();
        }
        /// <summary>
        /// 設置數據標題
        /// </summary>
        /// <param name="datas"></param>
        private void SetDataTitle(List<ChartItem> datas)
        {
            RadarChartTitleList titleList = new RadarChartTitleList();
            titleList.ItemSoure = datas;
            double angle = Math.PI * 0.25;
            double x = TotalSize / 2 + (TotalSize / 2) * Math.Sin(angle);
            Canvas.SetLeft(titleList, x);
            Canvas.SetTop(titleList, x);
            CanvasPanel.Children.Add(titleList);
        }

        /// <summary>
        /// 設置標題
        /// </summary>
        private void SetArguments()
        {
            int index = 0;
            foreach (var argument in Arguments)
            {
                var button = new ChartButton();
                button.Content = argument.Name;
                button.Icon = argument.IconSource;
                button.MyButton.Click += OnClick;
                //繪製XY
                double currentAngle = Angle * index + 90;
                double angle = (currentAngle / 360) * 2 * Math.PI;
                var r = TotalSize / 2;
                double x = r + r * Math.Cos(angle) - (button.Width / 2);
                double y = r - r * Math.Sin(angle) - (button.Height / 2);

                //添加按鈕高度差異
                y = y + Math.Sin(angle) * (button.Width / 2 - button.Height / 2);

                Canvas.SetLeft(button, x);
                Canvas.SetTop(button, y);

                CanvasPanel.Children.Add(button);
                index++;
            }
        }

        /// <summary>
        /// 檢查數據
        /// </summary>
        /// <returns></returns>
        private bool CheckData()
        {
            if (Datas == null)
            {
                return false;
            }

            foreach (var data in Datas)
            {
                bool result = !Datas.Any(i => i.DataList.Count != data.DataList.Count);
                if (!result)
                {
                    return false;
                }
            }
            return true;
        }

        /// <summary>
        /// 設置面板和背景
        /// </summary>
        /// <param name="maxIndex"></param>
        private void SetCanvasAndBackground(int maxIndex)
        {
            CanvasPanel.Height = TotalSize;
            CanvasPanel.Width = TotalSize;

            //面板
            ChartCanvas.Height = Size;
            ChartCanvas.Width = Size;
            double canvasX = (TotalSize - Size) / 2;
            Canvas.SetLeft(ChartCanvas, canvasX);
            Canvas.SetTop(ChartCanvas, canvasX);
            CanvasPanel.Children.Add(ChartCanvas);
            //畫圈和直線
            var color = BorderBrush;
            double length = Size / 2 / maxIndex;
            for (int i = 0; i < maxIndex; i++)
            {
                double height = length * 2 * (i + 1);
                double left = Size / 2 - length * (i + 1);
                var ellipse = new Ellipse() { Stroke = color, StrokeThickness = 0.5, Height = height, Width = height };
                Canvas.SetLeft(ellipse, left);
                Canvas.SetTop(ellipse, left);

                ChartCanvas.Children.Add(ellipse);
            }
            //暫時設定:4個標題時,畫線
            if (Arguments.Count == 4)
            {
                //豎向直線
                Path verticalPath = new Path()
                {
                    Stroke = color,
                    StrokeThickness = 0.2,
                };
                //添加數據
                StreamGeometry geometry = new StreamGeometry();
                geometry.FillRule = FillRule.Nonzero; //聲前F0還是F1,現在是F1
                using (StreamGeometryContext ctx = geometry.Open())
                {

                    ctx.BeginFigure(new Point(Size / 2, 0), true, true);

                    ctx.LineTo(new Point(Size / 2, Size), true, false);

                }
                geometry.Freeze();
                verticalPath.Data = geometry;
                ChartCanvas.Children.Add(verticalPath);
                //橫向直線
                Path horizontalPath = new Path()
                {
                    Stroke = color,
                    StrokeThickness = 0.2,
                };
                //添加數據
                geometry = new StreamGeometry();
                geometry.FillRule = FillRule.Nonzero; //聲前F0還是F1,現在是F1
                using (StreamGeometryContext ctx = geometry.Open())
                {

                    ctx.BeginFigure(new Point(0, Size / 2), true, true);

                    ctx.LineTo(new Point(Size, Size / 2), true, false);

                }
                geometry.Freeze();
                horizontalPath.Data = geometry;
                ChartCanvas.Children.Add(horizontalPath);
            }
        }
        /// <summary>
        /// 分隔角度
        /// </summary>
        private double Angle
        {
            get
            {
                int count = Arguments.Count;
                double angle = 360 / count;
                return angle;
            }
        }
    }
    /// <summary>
    /// 類標題
    /// </summary>
    public class ArgumentModel
    {
        public ImageSource IconSource { get; set; }
        public string Name { get; set; }
    }
    /// <summary>
    /// 單組數據
    /// </summary>
    public class ChartItem
    {
        public Brush Color { get; set; }
        List<ChartData> dataList = new List<ChartData>();

        public List<ChartData> DataList
        {
            get { return dataList; }
            set { dataList = value; }
        }

        public object Name { get; set; }
    }
    /// <summary>
    /// 數據
    /// </summary>
    public class ChartData
    {
        public string Name { get; set; }
        public int Data { get; set; }
    }
View Code
2、創建標題類按鈕控制項,定義名稱為ChartButton


前臺:
<UserControl x:Class="WpfApplication2.ChartButton"
            xmlns="http://schemas.microsoft.com/winfx/2006/xaml/presentation"
            xmlns:x="http://schemas.microsoft.com/winfx/2006/xaml"
            xmlns:mc="http://schemas.openxmlformats.org/markup-compatibility/2006"
            xmlns:d="http://schemas.microsoft.com/expression/blend/2008"
            mc:Ignorable="d"
            d:DesignHeight="80" d:DesignWidth="200" Loaded="ChartButton_OnLoaded">
    <UserControl.Resources>
        <Style TargetType="Button">
            <Setter Property="Foreground" Value="White"></Setter>
        </Style>
    </UserControl.Resources>
    <Grid>
        <Button x:Name="MyButton" VerticalAlignment="Center" HorizontalAlignment="Center">
            <Button.Template>
                <ControlTemplate TargetType="{x:Type Button}">
                    <Grid x:Name="ButtonGrid" Height="{TemplateBinding Height}">
                        <Rectangle x:Name="ButtonRetc" RadiusX="20" RadiusY="25" Stroke="#FF06FFE8"></Rectangle>
                        <StackPanel Orientation="Horizontal" Margin="20,5" HorizontalAlignment="Center">
                            <Rectangle Height="{Binding IconHeight}" Width="{Binding IconWidth}">
                                <Rectangle.Fill>
                                    <ImageBrush ImageSource="{Binding Icon}"></ImageBrush>
                                </Rectangle.Fill>
                            </Rectangle>
                            <TextBlock x:Name="ButtonTextBlock" Text="{TemplateBinding Content}" Foreground="{TemplateBinding Foreground}" Margin="8,-2,0,0" FontSize="22" VerticalAlignment="Center" TextAlignment="Center"></TextBlock>
                        </StackPanel>
                    </Grid>
                    <ControlTemplate.Triggers>
                        <DataTrigger Binding="{Binding ElementName=MyButton,Path=IsFocused}" Value="True">
                            <DataTrigger.Setters>
                                <Setter TargetName="ButtonRetc" Property="Fill" Value="#FFA9BCFF"></Setter>
                                <Setter TargetName="ButtonRetc" Property="StrokeThickness" Value="0.5"></Setter>
                                <Setter TargetName="ButtonTextBlock" Property="Foreground" Value="#FF06FFE8"></Setter>
                            </DataTrigger.Setters>
                        </DataTrigger>
                        <DataTrigger Binding="{Binding ElementName=MyButton,Path=IsPressed}" Value="true">
                            <DataTrigger.Setters>
                                <Setter TargetName="ButtonTextBlock" Property="FontWeight" Value="Bold"></Setter>
                            </DataTrigger.Setters>
                        </DataTrigger>
                        <DataTrigger Binding="{Binding ElementName=MyButton,Path=IsFocused}" Value="false">
                            <DataTrigger.Setters>
                                <Setter TargetName="ButtonRetc" Property="Fill" Value="Transparent"></Setter>
                                <Setter TargetName="ButtonRetc" Property="StrokeThickness" Value="0"></Setter>
                            </DataTrigger.Setters>
                        </DataTrigger>
                    </ControlTemplate.Triggers>
                </ControlTemplate>
            </Button.Template>
        </Button>
    </Grid>
</UserControl>
View Code
後臺:
/// <summary>
    /// ChartButton.xaml 的交互邏輯
    /// </summary>
    public partial class ChartButton : UserControl
    {
        public ChartButton()
        {
            InitializeComponent();
        }
        #region 屬性
        /// <summary>
        /// 工具提示
        /// </summary>
        public string ToolTip
        {
            get { return (string)GetValue(ToolTipProperty); }
            set { SetValue(ToolTipProperty, value); }
        }
        public static readonly DependencyProperty ToolTipProperty = DependencyProperty.Register("ToolTip",
        typeof(string), typeof(ChartButton), new PropertyMetadata());
        /// <summary>
        /// 按鈕內容
        /// </summary>
        public string Content
        {
            get { return (string)GetValue(ContentProperty); }
            set { SetValue(ContentProperty, value); }
        }
        public static readonly DependencyProperty ContentProperty = DependencyProperty.Register("Content",
        typeof(string), typeof(ChartButton), new PropertyMetadata("按鈕"));
        /// <summary>
        /// 圖標
        /// </summary>
        public ImageSource Icon
        {
            get { return (ImageSource)GetValue(IconProperty); }
            set { SetValue(IconProperty, value); }
        }
        public static readonly DependencyProperty IconProperty = DependencyProperty.Register("Icon",
        typeof(ImageSource), typeof(ChartButton), new PropertyMetadata());
        /// <summary>
        /// 圖標高度
        /// </summary>
        public double IconHeight
        {
            get { return (double)GetValue(IconHeightProperty); }
            set { SetValue(IconHeightProperty, value); }
        }
        public static readonly DependencyProperty IconHeightProperty = DependencyProperty.Register("IconHeight",
        typeof(double), typeof(ChartButton), new PropertyMetadata(25.0));
        /// <summary>
        /// 圖標寬度
        /// </summary>
        public double IconWidth
        {
            get { return (double)GetValue(IconWidthProperty); }
            set { SetValue(IconWidthProperty, value); }
        }
        public static readonly DependencyProperty IconWidthProperty = DependencyProperty.Register("IconWidth",
        typeof(double), typeof(ChartButton), new PropertyMetadata(25.0));
        /// <summary>
        /// 高度
        /// </summary>
        public double Height
        {
            get { return (double)GetValue(HeightProperty); }
            set { SetValue(HeightProperty, value); }
        }
        public static readonly DependencyProperty HeightProperty = DependencyProperty.Register("Height",
        typeof(double), typeof(ChartButton), new PropertyMetadata(46.0));
        /// <summary>
        /// 寬度
        /// </summary>
        public double Width
        {
            get { return (double)GetValue(WidthProperty); }
            set { SetValue(WidthProperty, value); }
        }
        public static readonly DependencyProperty WidthProperty = DependencyProperty.Register("Width",
        typeof(double), typeof(ChartButton), new PropertyMetadata(170.0));
        #endregion

        private void ChartButton_OnLoaded(object sender, RoutedEventArgs e)
        {
            MyButton.ToolTip = ToolTip;
            MyButton.Content = Content;
            MyButton.Width = Width;
            MyButton.Height = Height;
            if (Icon != null)
            {
                MyButton.DataContext = new ChartButtonModel()
                {
                    Icon = Icon,
                    IconHeight = IconHeight,
                    IconWidth = IconWidth
                };
            }
        }
    }

    public class ChartButtonModel
    {