感謝 非常感謝Bill Wing和Christoph Deil的審閱和更正。 作者:Nicolas Rougier, Mike Müller, Gaël Varoquaux 本章內容: 介紹 簡單繪圖 圖形,子圖,軸線和刻度 其他類型的圖形:示例和練習 教程之外的內容 快速參考 4.1 介紹 Mat ...
感謝
非常感謝Bill Wing和Christoph Deil的審閱和更正。
作者:Nicolas Rougier, Mike Müller, Gaël Varoquaux
本章內容:
- 介紹
- 簡單繪圖
- 圖形,子圖,軸線和刻度
- 其他類型的圖形:示例和練習
- 教程之外的內容
- 快速參考
4.1 介紹
Matplotlib可能是二維圖形中最常用的Python包。它提供了一個非常快的可視化Pyhton數據的方法和許多可供發佈的格式化圖形。我們要以交互方式探索Matplotlib大多數常見情況。
4.1.1 IPython和Matplotlib模式
Ipython是一個增強的互動式Python Shell。它有許多有趣的功能,包括命名輸入和輸出、訪問Shell命令、改進調試和更多內容。它是Pyhton中科學計算工作流的核心,與Matplotlib結合一起使用。
關於Matlab/Mathematica類似功能的互動式Matplotlib會話,我們使用IPython和它的特殊Matplotlib模式,使能夠非阻塞繪圖。
Ipython console 當使用IPython控制台時,我們以命令行參數--matplotlib啟動它(-pylab命令被用在非常老的版本中)
IPthon notebook 在IPthon notebook中,我們在notebook的起始處插入以下魔法函數:%matplotlib inline
4.1.2 pyplot
pyplot為matplotlib面向對象的繪圖庫提供了一個程式介面。它是接近於Matlab的建模工具。因此,plot中的大多數繪圖命令都具有類似的Matlab模擬參數。重要的命令用交互示例解釋。
from matplotlib import pyplot as plt
4.2 簡單繪圖
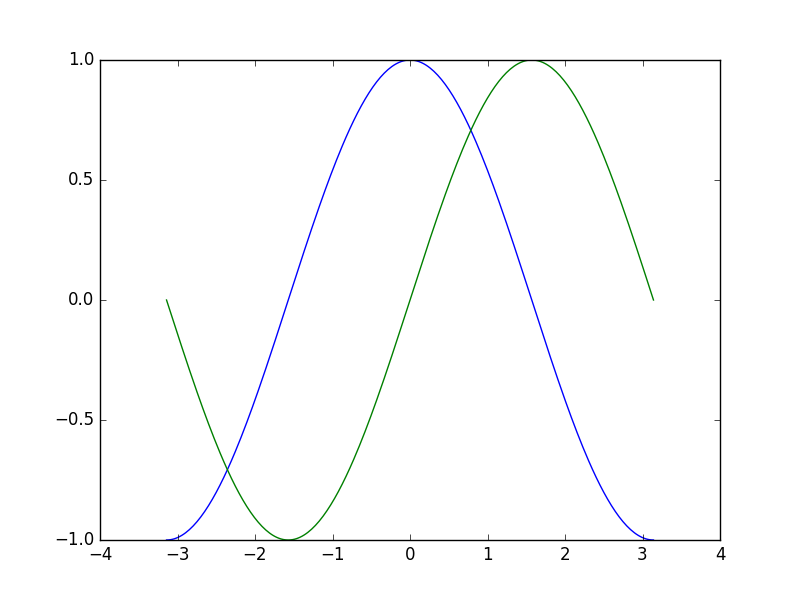
在本節中,我們要在同一個圖上繪製餘弦和正弦函數,我們將從預設設置開始,逐步充實圖形,使其變得更好。
第一步:獲取正弦和餘弦函數的數據
import numpy as np

X = np.linspace(-np.pi, np.pi, 256, endpoint=True)
C, S = np.cos(X), np.sin(X)
X現在是一個numpy數組,有256個值,範圍從-π到+π(包括),C是餘弦(256個值),S是正弦(256個值)。
要運行該示例,你可以在IPython互動式會話中鍵入它:
$ ipython --pylab
這使我們來到IPython命令提示符:
IPython 0.13 -- An enhanced Interactive Python.
? -> Introduction to IPython's features.
%magic -> Information about IPython's 'magic' % functions.
help -> Python's own help system.
object? -> Details about 'object'. ?object also works, ?? prints more.
Welcome to pylab, a matplotlib-based Python environment.
For more information, type 'help(pylab)'.
你也可以下載每個例子,使用常規Python命令運行它,但是你會失去交互數據操作。
$ python exercice_1.py
你可以通過點擊相應的圖形來獲取每個步驟的源。
4.2.1 使用預設設置繪圖
Documentation
- plot tutorial
- plot() command
import numpy as np
import matplotlib.pyplot as plt

X = np.linspace(-np.pi, np.pi, 256, endpoint=True)
C, S = np.cos(X), np.sin(X)

plt.plot(X, C)
plt.plot(X, S)

plt.show()
4.2.2 實例化預設值
Documentation
- Customizing matplotlib
import numpy as np
import matplotlib.pyplot as plt

# Create a figure of size 8x6 inches, 80 dots per inch
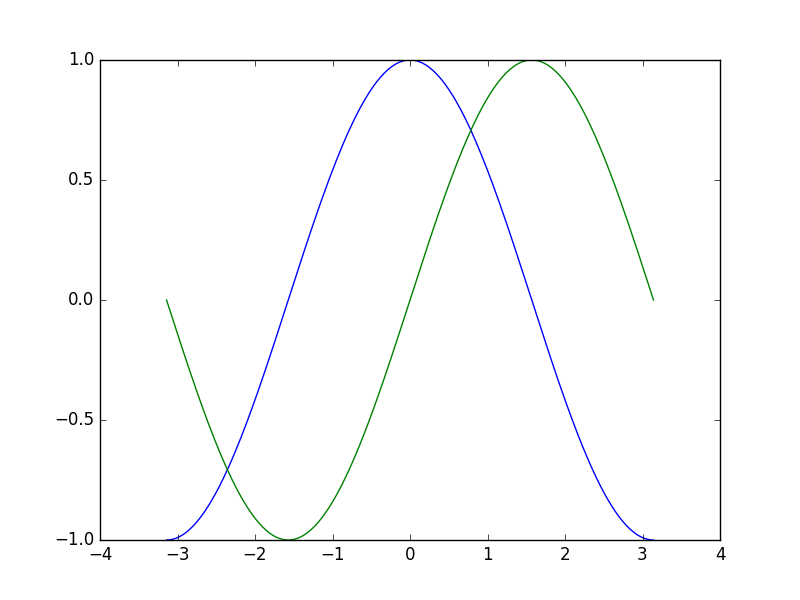
plt.figure(figsize=(8, 6), dpi=80)

# Create a new subplot from a grid of 1x1
plt.subplot(1, 1, 1)

X = np.linspace(-np.pi, np.pi, 256, endpoint=True)
C, S = np.cos(X), np.sin(X)

# Plot cosine with a blue continuous line of width 1 (pixels)
plt.plot(X, C, color="blue", linewidth=1.0, linestyle="-")

# Plot sine with a green continuous line of width 1 (pixels)
plt.plot(X, S, color="green", linewidth=1.0, linestyle="-")

# Set x limits
plt.xlim(-4.0, 4.0)

# Set x ticks
plt.xticks(np.linspace(-4, 4, 9, endpoint=True))

# Set y limits
plt.ylim(-1.0, 1.0)

# Set y ticks
plt.yticks(np.linspace(-1, 1, 5, endpoint=True))

# Save figure using 72 dots per inch
# plt.savefig("exercice_2.png", dpi=72)

# Show result on screen
plt.show()
4.2.3 改變顏色和線寬
Documentation
- Controlling line properties
- Line API
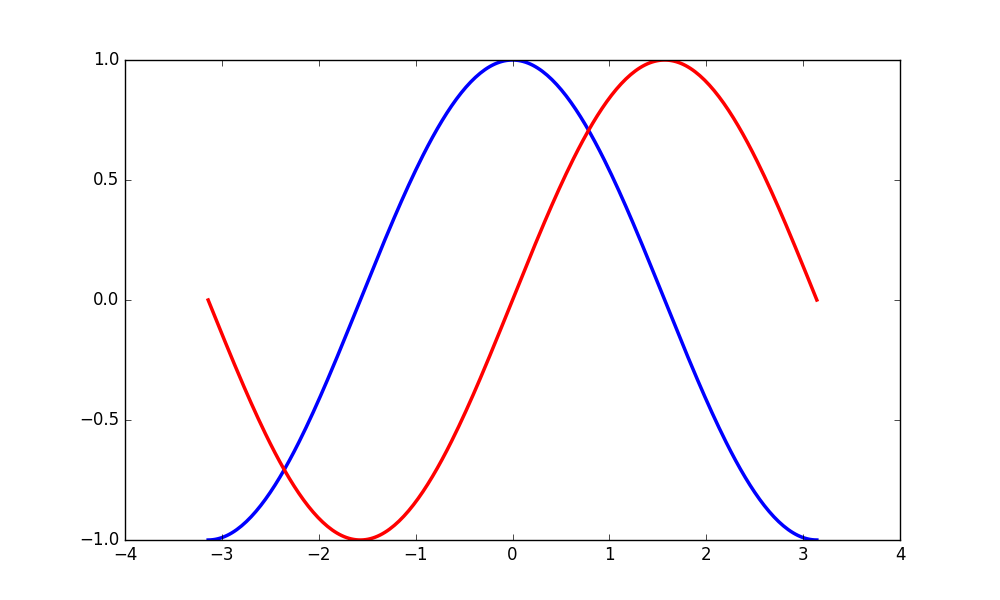
第一步,我們要將餘弦函數設置為藍色,正弦函數設置為紅色,並且將它們都設置為稍微粗的線型。我們也會稍微改變一下圖形的大小,使其更加水平。
...
plt.figure(figsize=(10, 6), dpi=80)
plt.plot(X, C, color="blue", linewidth=2.5, linestyle="-")
plt.plot(X, S, color="red", linewidth=2.5, linestyle="-")
...
4.2.4 設置限定值
Documentation
- xlim() command
- ylim() command
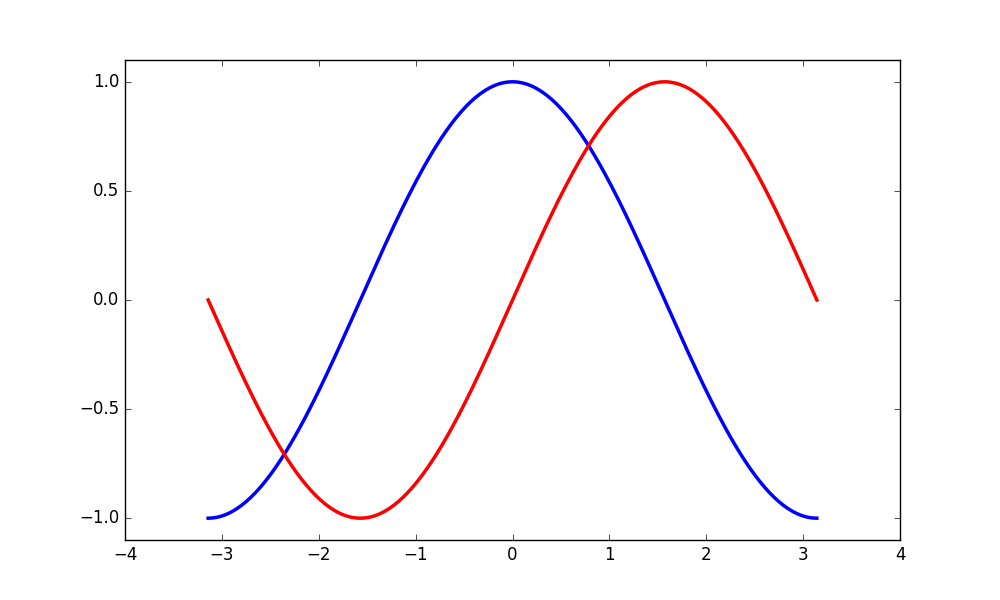
當前圖形的限定值有點緊湊,我們想要一些空間,以便清楚地查看所有數據點。
...
plt.xlim(X.min() * 1.1, X.max() * 1.1)
plt.ylim(C.min() * 1.1, C.max() * 1.1)
...
4.2.5 設置刻度值
Documentation
- xticks() command
- yticks() command
- Tick container
- Tick locating and formatting
...
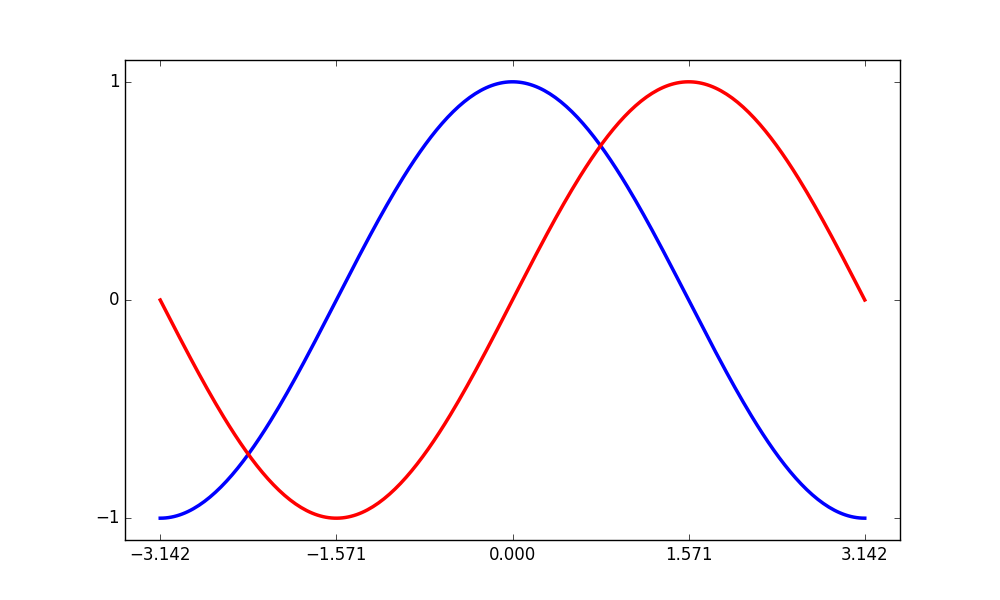
plt.xticks([-np.pi, -np.pi/2, 0, np.pi/2, np.pi])
plt.yticks([-1, 0, +1])
...
4.2.6 設置刻度標記
Documentation
- Working with text
- xticks() command
- yticks() command
- set_xticklabels()
- set_yticklabels()
...
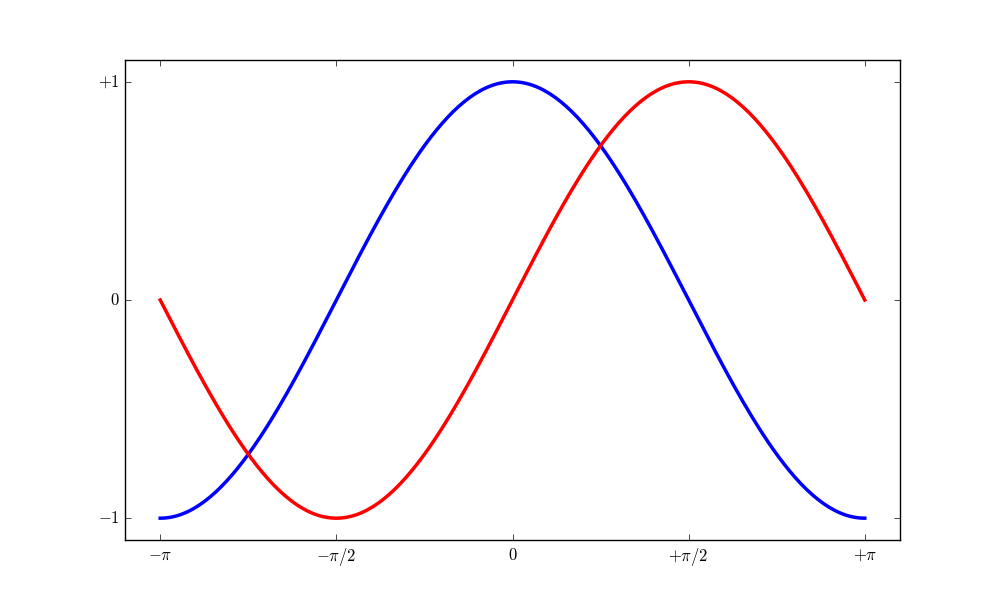
plt.xticks([-np.pi, -np.pi/2, 0, np.pi/2, np.pi],
[r'$-\pi$', r'$-\pi/2$', r'$0$', r'$+\pi/2$', r'$+\pi$'])
plt.yticks([-1, 0, +1],
[r'$-1$', r'$0$', r'$+1$'])
...
4.2.7 運動自旋

Documentation
- Spines
- Axis container
- Transformations tutorial
...
ax = plt.gca() # gca stands for 'get current axis'
ax.spines['right'].set_color('none')
ax.spines['top'].set_color('none')
ax.xaxis.set_ticks_position('bottom')
ax.spines['bottom'].set_position(('data',0))
ax.yaxis.set_ticks_position('left')
ax.spines['left'].set_position(('data',0))
...
4.2.8 添加圖例
Documentation
- Legend guide
- legend() command
- Legend API
...
plt.plot(X, C, color="blue", linewidth=2.5, linestyle="-", label="cosine")
plt.plot(X, S, color="red", linewidth=2.5, linestyle="-", label="sine")
plt.legend(loc='upper left')
...
4.2.9 註釋一些點
Documentation
- Annotating axis
- annotate() command
...

t = 2 * np.pi / 3
plt.plot([t, t], [0, np.cos(t)], color='blue', linewidth=2.5, linestyle="--")
plt.scatter([t, ], [np.cos(t), ], 50, color='blue')

plt.annotate(r'$sin(\frac{2\pi}{3})=\frac{\sqrt{3}}{2}$',
xy=(t, np.sin(t)), xycoords='data',
xytext=(+10, +30), textcoords='offset points', fontsize=16,
arrowprops=dict(arrowstyle="->", connectionstyle="arc3,rad=.2"))

plt.plot([t, t],[0, np.sin(t)], color='red', linewidth=2.5, linestyle="--")
plt.scatter([t, ],[np.sin(t), ], 50, color='red')

plt.annotate(r'$cos(\frac{2\pi}{3})=-\frac{1}{2}$',
xy=(t, np.cos(t)), xycoords='data',
xytext=(-90, -50), textcoords='offset points', fontsize=16,
arrowprops=dict(arrowstyle="->", connectionstyle="arc3,rad=.2"))

...
4.2.10


